Figures & data
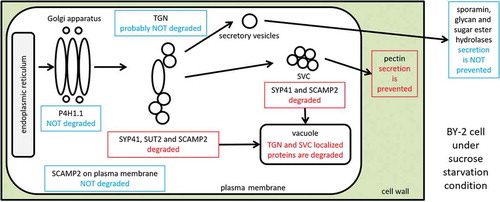
Figure 1. Tobacco SUT2 is a TGN-localizing protein that is degraded under the sucrose-limitation condition. (a) Distribution of SUT2-GFP and SUT4-GFP fusion proteins in 3-day-old BY-2 cells. Images collected by differential interference contrast microscopy (DIC) and confocal fluorescence microscopy at the wavelength for green fluorescence protein detection (GFP) were shown. (b) Association of SUT2-GFP with a Golgi marker P4H1.1-mRFP. Confocal images of GFP and RFP detection conditions and the merged images of these two records were shown. The most left image is an enlarged image of the boxed area in the merged image. (c) Co-localization of SUT2-mRFP and YFP-SYP41. Confocal images of GFP and RFP detection conditions and the merged images of these two records were shown. The most left image is an enlarged image of the boxed area in the merged image. (d) Starvation-induced degradation of SUT2-GFP. Representative gel image (upper) and quantified result (lower graph) of SUT2-GFP, SUT4-GFP, and P4H1.1-mRFP in cells that were cultured in the various medium for 24 h. Experiments were repeated twice and obtained conceptually identical results. Average of two experiments were shown in these graphs. Suc, sucrose-containing medium; Man, mannitol containing, and sucrose-free medium, Glc, glucose-containing and sucrose-free medium, -N, nitrogen-free medium, -P, phosphate-free medium. (e) Time-course of the decrease of SUT2-GFP fluorescence in the normal and sucrose-free medium. (f) Decrease of endogenous SUT2 under sucrose-limitation condition. Equal amount of microsomal proteins from tobacco BY-2 cells that have been cultured for 24 h in either normal or sucrose-free medium were separated by SDS-PAGE, transferred to PVDF membrane and probed with a specific antibody against tobacco SUT2. Bars in a-c represent 10 μm.
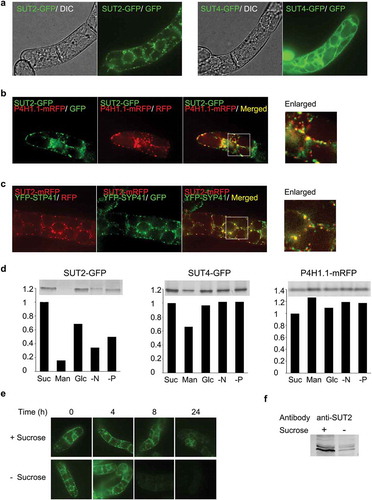
Figure 2. Another TGN-localizing protein, SYP41, was also degraded under sucrose limitation. (a) YFP-SYP41 gel image and quantified results. Decrease of YFP-SYP41 fluorescent under sucrose-limitation condition. Equal amount of microsomal proteins from tobacco cells that have been cultured for 24 h in either normal or sucrose-free medium were separated by SDS-PAGE and fluorescence images recorded as described in the materials and methods section. Experiments were repeated twice and obtained conceptually identical results. Average of the two experiments were shown. (b) Immunoblot detection of endogenous SYP41. Equal amount of microsomal proteins from tobacco cells that has been cultured for 24 h in either normal or sucrose-free medium were separated by SDS-PAGE, transferred to PVDF membrane and probed with a specific antibody against tobacco SYP41. Arrowhead indicates the tobacco SYP41 protein recognized by this antibody.
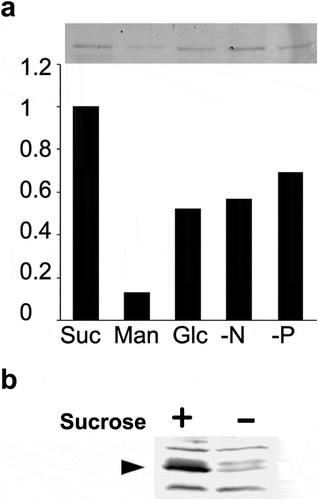
Figure 3. TGN and SVC localization of SCAMP2 was abolished in the sucrose-starved cells. (a) Fluorescence images of NtSCAMP2-mRFP. Confocal images of red fluorescence in 3-day old cells (left), cells in 24 h in normal media (center) or sucrose-limitation condition (right) were shown. Bars, 10 μm. (b) Quantified results of the cell with red dots. Number of BY-2 cells with and without red dots were counted and the percentage of cells with dots were calculated as described in the materials and methods. Average of three independent experiments for 3-day old cells (3d), 24 h in normal media (+Suc) and sucrose-limitation condition (-Suc) were shown. Error bar, SD. (c) Quantified results of a number of dots in cells. Number of red dots in the cell was counted calculated as described in the materials and methods. Average of three independent experiments for 3 day old cells (3d), 24 h in normal media (+Suc) and sucrose-limitation condition (-Suc) were shown. Error bar, SD.
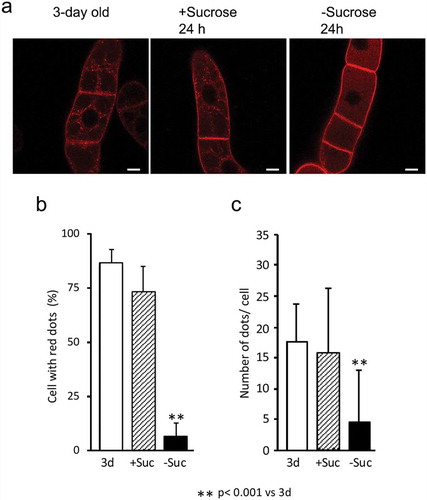
Figure 4. Autophagy inhibitors prevent the degradation of SUT2-GFP and YFP-SYP41. (a) Confocal fluorescence images of SUT2-GFP-expressing tobacco cells that has been cultured in normal (+) and sucrose-free (-) medium with inhibiters for autophagy (E-64 or 3-MA) at concentrations described in the Materials and methods section or without inhibiter (Control) for 24 h. Microscopic images were collected as described in the legend to ). The backgrounds of these images were adjusted between images by subtracting the average intensity of the non-cell part of each image using ImageJ. (b) SUT2-GFP cells were cultured as in a in the absence (Control) and presence of indicated inhibitors for 24 h in medium with (+) or without (-) sucrose. Equal amounts of microsomal proteins were separated by SDS-PAGE and RFP fluorescence in the gel was recorded as described in the Materials and methods section. Migration positions of SUT2-GFP and its degradation products were indicated at the left of the gel image. (c) Effect of autophagy inhibitors on the degradation of YFP-SYP41. Tobacco cells expressing YFP-SYP41 were incubated with or without inhibitors as described in the legend to b. YFP-SYP41 fluorescence was visualized after separation of proteins as described in the legend to ).
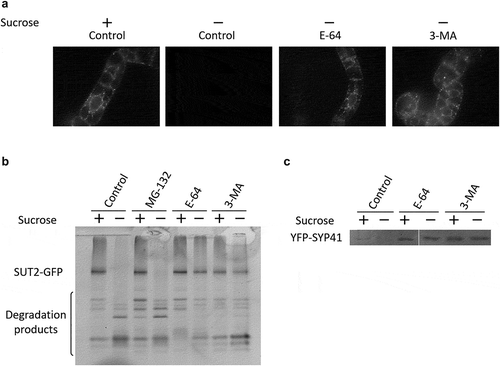
Figure 5. TGN is present in the starved cells. (a) Confocal fluorescence images of tobacco cells that have been cultured in normal (+Sucrose) and sucrose-free (-Sucrose) medium for 23 h were incubated with FM 1–43 for 30 min. Upper panels, non-transformed BY-2 cells; lower panels, transformed BY-2 cells expressing a Golgi marker P4H1.1-mRFP. Inserts at the top right of the images are the enlarged image of the boxed area. Arrowheads indicate the green dots located proximate to the red dot of Golgi apparatus. Bars, 10 μm. (b) Quantified results of FM1-43 dots in the cells. Number of dots in cells were counted as described in the materials and methods from images taken from cells that have been incubated with FM 1–43 for 20 to 40 min. Average of three independent experiments were shown. Error bar, SD.
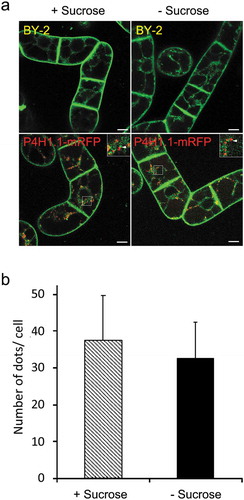
Figure 6. Secretion of pectin was inhibited from sucrose-starved tobacco cells. (a) Time-course analysis of the change of pectin in cell wall fraction prepared from cells cultured in normal and sucrose-free medium. Amount of pectin corresponding to 1 mL culture was shown. (b) Time-course analysis of the change of pectin in medium fraction as in a. (c) Time-course analysis of the change of the relative amount of cell volume in a unit culture volume. (a-c) Data are means ± SD. (n = 5).
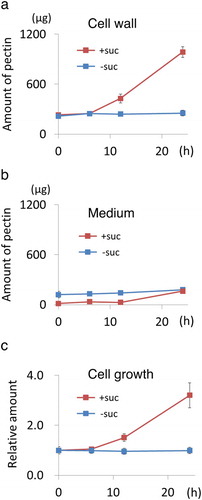
Figure 7. Secretion of a model soluble protein sporamin from cells cultured in normal and sucrose-free medium. Transformed tobacco cells expressing a secretory form of sporamin [Citation17] was used in this experiment. (a) Time-course analysis of the increase of sporamin in the medium. Immunoblot with equal amounts of medium fractions in each lane was shown. (b) Results of the quantification of immunoblot. Experiments were repeated twice and obtained conceptually identical results.
![Figure 7. Secretion of a model soluble protein sporamin from cells cultured in normal and sucrose-free medium. Transformed tobacco cells expressing a secretory form of sporamin [Citation17] was used in this experiment. (a) Time-course analysis of the increase of sporamin in the medium. Immunoblot with equal amounts of medium fractions in each lane was shown. (b) Results of the quantification of immunoblot. Experiments were repeated twice and obtained conceptually identical results.](/cms/asset/54f6356f-8cf1-49d2-a344-57a8a3df5a29/tbbb_a_1756736_f0007_oc.jpg)
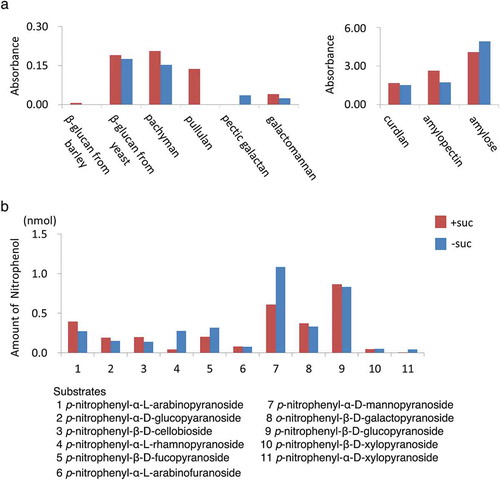
Figure 8. Glycan and sugar-ester hydrolases were secreted from cells incubated in both normal and sucrose-free medium. Culture medium of non-transformed tobacco BY-2 cells incubated for 24 h in either normal or sucrose-free medium was used in this study. (a) Glycan hydrolase activities were measured as described in materials and methods using chromophore-tagged and immobilized substrates using CPH assay kit as described in the materials and methods section. Relative amounts of eluted chromophore-tag released from immobilized substrates corresponding to 50 μL of medium was shown. (b) Sugar-ester hydrolases activities. Amount of released nitrophenol absorbance corresponding to 5 μL of medium in an hour was shown for each substrate. Red bars indicate the amount of nitrophenol under sucrose exist condition and blue bars indicates the amount of nitrophenol under sucrose-limitation condition.