Figures & data
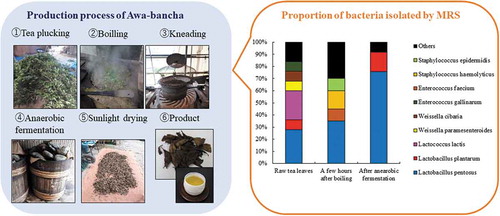
Figure 1. The production area and production process of Awa-bancha.
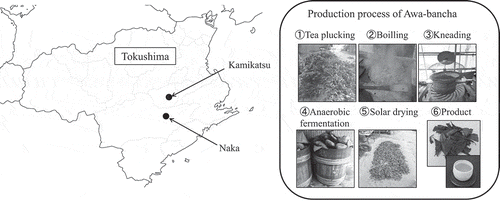
Table 1. Samples collected from different producer.
Figure 2. Number of bacteria in each production process.
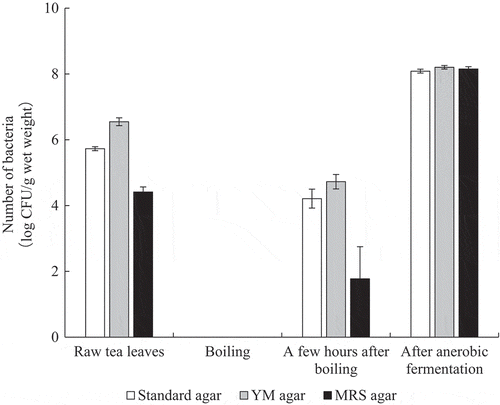
Figure 3. Analysis of the bacterial flora by 16 S rRNA genes using a next-generation sequencer.
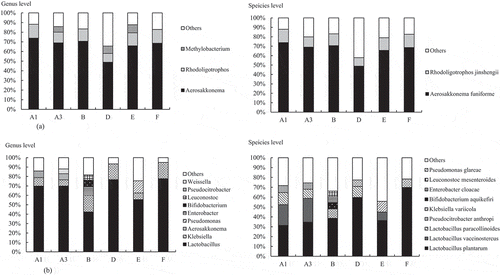
Table 2. Number of bacteria isolated by MRS agar plates in each product process.
Figure 4. The proportion of bacteria isolated by MRS agar plates in each production process.
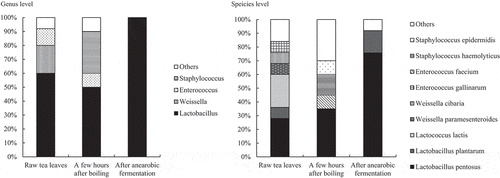
Table 3. Growth of lactic acid bacteria isolated on green tea extract medium containing 1% glucose.
Table 4. Sugar utilization of Lactobacillus pentosus isolated.
Table 5. Contents of organic acids and pH in Awa-bancha.
Table 6. Contents of free amino acids in Awa-bancha.
Table 7. Contents of caffeine and catechins in Awa-bancha.
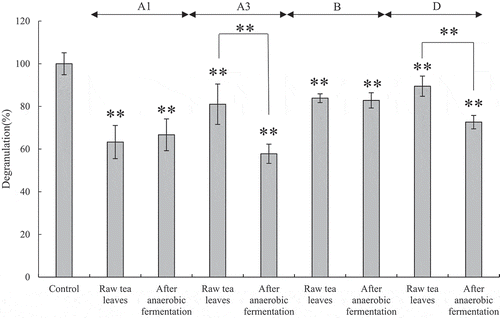
Figure 5. Evaluation of degranulation by the tea extract for RBL-2H3 cells.