Figures & data

Figure 1. The chemical structures of 3DP and DMHF.
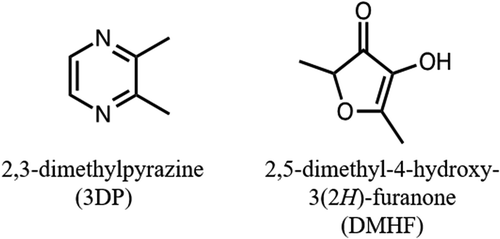
Figure 2. The location design of a measurement channel of a probe holder in near-infrared spectroscopy.
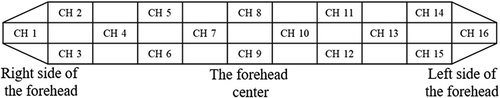
Figure 3. POMS 2® scores for air (control) and odor inhalation.
Mean±SE (n = 26) of (a) the Maillard reaction sample, (b) 3DP, (c) DMHF. AH: anger-hostility; CB: confusion-bewilderment; DD: depression-dejection; FI: fatigue-inertia; TA: tension-anxiety; VA: vigor-activity; F: friendliness. *: p < 0.05; §: p < 0.001, vs. before inhalation, compared by paired t-test.
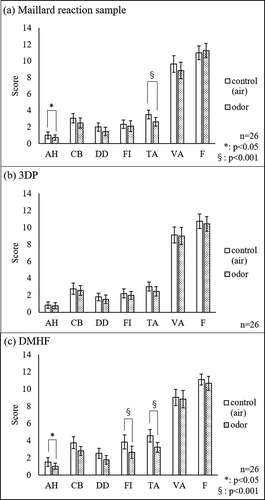
Figure 4. Effect of the odor of the Maillard reaction sample, 3DP, and DMHF on physiological parameters.
Mean±SE (n = 26) of (a) miosis rate of the pupillary light reflex, (b) fingertip temperature, (c) flicker frequency value. §: p < 0.001; ‡: p < 0.005; ††: p < 0.00001 by paired t-test.
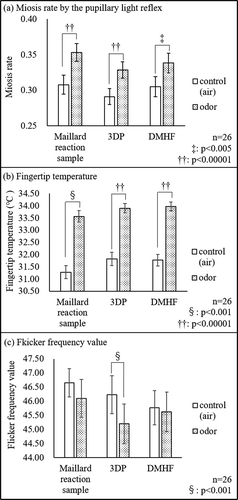
Table 1. Changes in oxy-Hb concentration (mM/mm) before and during odor inhalation of the Maillard reaction sample, DMHF, and 3DP (n = 26).
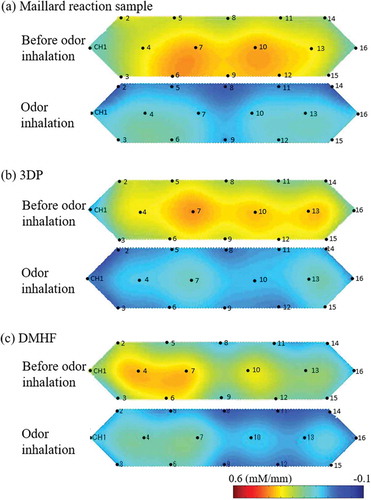
Figure 5. Illustration of changes in oxy-Hb concentration (hemodynamic responses) by NIRS.
Mean of (a) the Maillard reaction sample, (b) 3DP, (c) DMHF for 2 min before odor inhalation and 2 min during odor inhalation. Red color represents an increase in oxy-Hb concentration, and blue color represents a decrease in oxy-Hb.