Figures & data
Table 1. Effect of diosgenin on TNBS induced alterations in body weight, colon weight, colon weight to length ratio, ulcer area, ulcer index, disease activity index, macroscopic score and stool consistency score in rats.
Figure 1. Morphological representation of colons from Normal (a), TNBS control (b), 5-ASA (500 mg/kg) (c), Diosgenin (100 mg/kg) (d), Diosgenin (200 mg/kg) (e) and Per Se (f) treated rats.
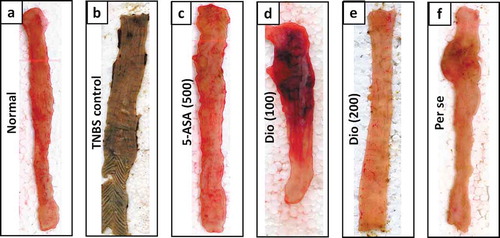
Table 2. Effect of diosgenin on TNBS induced alterations in colonic SOD, GSH, MDA, NO, hydroxyproline, and MPO in rats.
Table 3. Effect of diosgenin on TNBS induced alterations in colonic TNF-α, IL-1β, IL-6, IL-10, IFN-γ, iNOs, COX-2 and LTB4 mRNA expressions in rats.
Figure 2. Effect of diosgenin on TNBS induced alterations in colonic NF-κB (a), IκBα (b), Bax (c) and Caspase-1 (d) protein expression in rats. Data are expressed as mean ± S.E.M. (n = 6) and analyzed by one way ANOVA followed by Tukey’s multiple range test. *p < 0.05 as compared to TNBS control group, #p < 0.05 as compared to normal group and $p < 0.05 as compared to one another (diosgenin and 5-ASA). Representative protein expression of Normal (Lane 1), TNBS control (Lane 2), 5-ASA (500 mg/kg) (Lane 3), Diosgenin (50 mg/kg) (Lane 4), Diosgenin (100 mg/kg) (Lane 5), Diosgenin (200 mg/kg) (Lane 6) and Per Se (Lane 7) treated rats. TNBS: 2,4,6-Trinitrobenzenesulfonic acid; 5-ASA: 5-Aminosalicylic acid; Dio: Diosgenin; p-NF-κB: Phospho Nuclear Factor kappa B; p-IκBα: nuclear factor of kappa light polypeptide gene enhancer in B-cells inhibitor-alpha, Bax: Bcl-2-associated × protein and GAPDH: Glyceraldehyde 3-phosphate dehydrogenase.
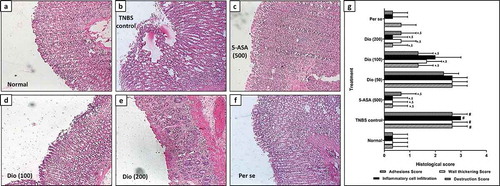
Figure 3. Effect of diosgenin on TNBS induced alterations in colon histopathology. Photomicrograph of sections of colon tissue from Normal (a), TNBS control (b), 5-ASA (500 mg/kg) (c), Diosgenin (100 mg/kg) (d), Diosgenin (200 mg/kg) (e) and Per Se (f) treated rats stained with H&E stain. The quantitative representation of histological score (g). Data are expressed as mean ± S.E.M. (n = 3) and analyzed by one way ANOVA followed by the Kruskal-Wallis test was applied for post hoc analysis. *p < 0.05 as compared to TNBS control group, #p < 0.05 as compared to normal group and $p < 0.05 as compared to one another (diosgenin and 5-ASA). TNBS: 2,4,6-Trinitrobenzenesulfonic acid; 5-ASA: 5-Aminosalicylic acid; Dio: Diosgenin. Red arrow indicated inflammatory infiltration, and yellow arrow indicated necrosis. Images (×40 magnification) are typical and are representative of each study group.