
Figures & data
Figure 1. CX5461 suppressed the growth of acute leukemia cell lines.
(a) CX5461 suppressed pre-rRNA expression. HL-60 cells were treated with the indicated concentrations of CX5461 for 1 h, and pre-rRNA expression was determined via RT-qPCR. Data are presented as mean ± SD of three independent experiments. (b) HL-60, KG-1, and THP-1 cells were treated with the indicated concentrations of CX5461 (0–10,000 nM) at specific time points, and the survival rate was assessed using 3-(4,5-dimethylthiazol-2-yl)-2,5-diphenyl tetrazolium bromide (MTT) assay. (c) Half-maximal inhibitory concentration (IC50) values of CX5461 are presented for each cell line. d and e, HL-60, KG-1, and THP-1 cells were treated with different concentrations of CX5461 (0, 100, 250, or 500 nM) for 24 h, stained with propidium iodide, and analyzed via flow cytometry. Cell fractions in the G0/G1 (gray), S (black), and G2/M (white) phases are presented (n = 3). Data are presented as means ± SD of three independent experiments.
Figure 2. CX5461 induced apoptosis in acute myeloid leukemia cell lines.
(a) HL-60, KG-1, and THP-1 cells were treated with different concentrations of CX5461 (0, 100, 250, or 500 nM) for 24 h. The appearance of apoptotic cells was assessed via flow cytometry using annexin V/propiodium iodide staining. (b) Apoptotic cell fractions are represented by black bars. Data are presented as means ± SD of three independent experiments: ***p < 0.001, **p < 0.01, and *p < 0.05. c, HL-60, KG-1, and THP-1 cells were treated with different concentrations of CX5461 (0, 100, 250, or 500 nM) for 24 h. Protein lysates were analyzed via immunoblotting analysis to identify cleaved PARP (C-PARP). The amount of beta-actin was assessed as a loading control. The single-positive fraction for annexin V indicated early apoptosis, and the double-positive fraction for annexin V/PI indicated late apoptosis. The value in the right area indicates the proportions of cells during early or late apoptosis. The results for KG-1 and THP-1 cells are not presented.
Figure 3. Treatment with CX5461 enhanced autophagy in acute myeloid leukemia cell lines.
(a) HL-60 cells were treated with the indicated concentrations of CX5461 for 24 h, harvested for cytospin preparations, and immunostained with anti-LC3A/B antibody followed by Alexa Fluor 488 (green)-conjugated secondary antibody and Hoechst (blue). (b) HL-60, KG-1, and THP-1 cells were treated with different concentrations of CX5461 (0, 100, 250, or 500 nM) for 24 h. Protein lysates were analyzed via immunoblotting to identify LC3A/B-I and LC3A/B-II. β-actin served as a loading control.
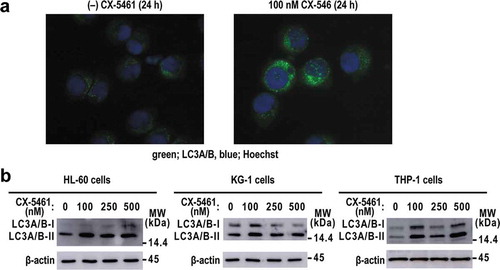
Figure 4. Co-treatment with chloroquine and CX5461 enhanced the efficacy of CX5461.
(a) HL-60, KG-1, and THP-1 cells were treated with different concentrations of CQ (0, 25, 50, or 100 µM) for 24 h. Protein lysates were analyzed via immunoblotting to identify LC3A/B-II. β-tubulin served as a loading control. (b) HL-60, KG-1, and THP-1 cells were treated with CX5461 (0 or 100 nM) and CQ (0 or 100 µM) for 24 h. The appearance of apoptotic cells was assessed via flow cytometry using annexin V/propidium iodide (PI). The single-positive fraction for annexin V indicated early apoptosis, and the double-positive fraction for annexin V/PI indicated late apoptosis. The value of the right area indicated the proportion of cells in early and late apoptosis. The results for KG-1 and THP-1 cells are not presented. (c) Apoptotic cell fractions are represented by black bars. Data are presented as means ± SD of three independent experiments: **p < 0.01 and *p < 0.05. (d,e) Combination index (CI) was analyzed in three independent experiments.
Supplemental material