Figures & data

Table 1. Data collection and refinement statistics
Figure 1. Comparison of amino acid sequences of BiBftA and related GH68 enzymes. Sequences were aligned using the Clustal Omega server (https://www.ebi.ac.uk/Tools/msa/clustalo/), and manual adjustments were made based on crystal structures. The three catalytic residues are highlighted in red. Residues shown in ) are highlighted in green. Four conserved motifs, A-D, in GH32 and GH68 enzymes [Citation1] are boxed. Nine loops, 1–9, at the rim of the active site funnel [Citation24] are underlined in blue. The sequences (5 residues in loop-A and 13 C-terminal residues) that were deleted to improve crystallization are highlighted in yellow
![Figure 1. Comparison of amino acid sequences of BiBftA and related GH68 enzymes. Sequences were aligned using the Clustal Omega server (https://www.ebi.ac.uk/Tools/msa/clustalo/), and manual adjustments were made based on crystal structures. The three catalytic residues are highlighted in red. Residues shown in Figure 4(c) are highlighted in green. Four conserved motifs, A-D, in GH32 and GH68 enzymes [Citation1] are boxed. Nine loops, 1–9, at the rim of the active site funnel [Citation24] are underlined in blue. The sequences (5 residues in loop-A and 13 C-terminal residues) that were deleted to improve crystallization are highlighted in yellow](/cms/asset/4fcc5d85-701f-4246-844c-6e541245aa80/tbbb_a_1804317_f0001_oc.jpg)
Figure 2. Crystals and overall structure of BiBftA ΔAΔC. (a) Crystals of BiBftA ΔAΔC. (b) Overall structure of BiBftA ΔAΔC shown as a ribbon model. The five blades (i–v) comprising the β-propeller fold are shown in blue (I, III, and V) or cyan (II and IV). The N-terminal region that wraps around the β-propeller fold is shown in green. Three loops, loops 5, 7, and 8, are shown in orange. Magnesium ions on the molecular surface are shown as magenta balls. Disordered loop-A is shown as a dotted line. (c) Stereo view of the superimposed Cα backbones in BiBftA ΔAΔC (red), MsFFase (green), and BsSacB (blue). The small domain-like structure in the C-terminus of MsFFase is indicated with a green arrow
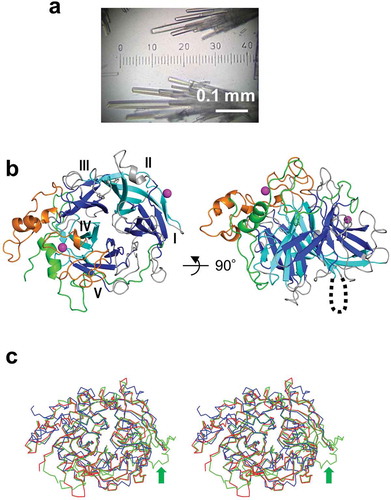
Figure 3. Enzymatic properties of full-length BiBftA. (a) Optimal pH was measured in 50 mM of sodium phosphate-citrate buffer (black circles), sodium phosphate buffer (white circles), and Tris-HCl buffer (black squares). (b) pH stability was determined by incubating BiBftA in 62.5 mM of sodium phosphate-citrate buffer (black circles), sodium phosphate buffer (white circles), and Tris-HCl buffer (black squares). (c) Optimal temperature. (d) Thermostability. In (a)–(d), error bars represent standard deviations. (e) BiBftA enzymatic activity with various sucrose concentrations. (f) TLC analysis of the BiBftA and sucrose reaction. Symbols: M, malto-oligosaccharide markers; G1, glucose; G2, maltose; G3, maltotriose; G4, maltotetraose; S, sucrose; F, fructose; K, 1-kestose
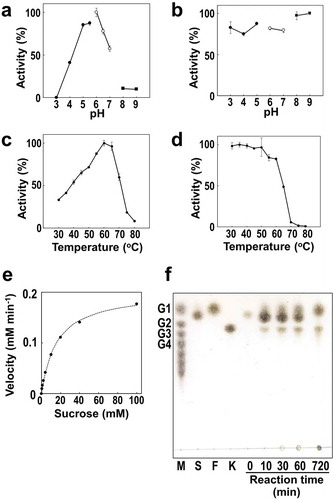
Table 2. Summary of the structural similarity search using the DALI server
Figure 4. Fru-bound structure of BiBftA ΔAΔC. (a) The positions of five Fru molecules, Fruf (i), Frup (ii), Frup (iii), Frup (iv), and Frup (v) in BiBftA ΔAΔC are shown in magenta. (b) |Fo|-|Fc| omit maps contoured at 3 σ. (c) Schematic of the amino acid residues interacting with Fruf (i) and Frup (ii). Colors: black circle, carbon atom; blue circle, nitrogen atom; red circle, oxygen atom; cyan circle, water molecule; green dashed line, hydrogen bond; red crown, hydrophobic interaction
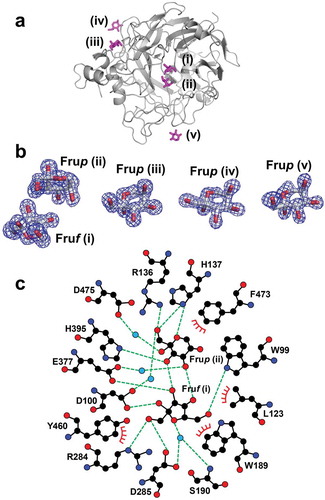
Figure 5. Stereo views of residues in the active sites of BiBftA ΔAΔC-Fru (a) and the corresponding residues in MsFFase (PDB code 3VSS) (b) and in EaLsc (PDB code 4D47) (c). Residues that form direct hydrogen bonds with Fruf (i) and Frup (ii), three aromatic residues, Trp189, Tyr460, and Phe473, and Ser461 in BiBftA ΔAΔC are indicated. Five residues that form direct hydrogen bonds with Fruf (i) in BiBftA ΔAΔC and the corresponding residues in (b) and (c) are shown in yellow. His137 and Ser461 in BiBftA ΔAΔC and the corresponding residues in (b) and (c) are shown in cyan. Fru and glucose (Glc) molecules are shown in green. Direct hydrogen bonds between amino acid residues and sugar molecules are indicated by magenta dotted lines. β-Fruf at subsite −1 in (b) is indicated as −1
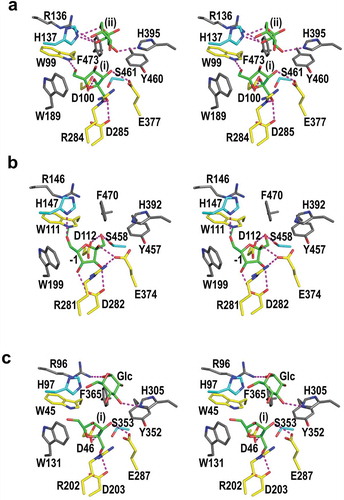
Table 3. Numbers of amino acid residues in the loops at the rim of the active site funnel in some GH68 enzymes
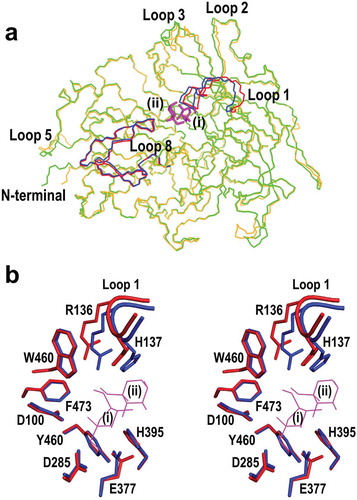
Figure 6. Comparison of unliganded BiBftA ΔAΔC and BiBftA ΔAΔC-Fru structures. (a) The conformational change in BiBftA ΔAΔC upon binding of Fru. Colors: blue, loop 1 and loop 8 of unliganded BiBftA ΔAΔC; green, unliganded BiBftA ΔAΔC; red, loop 1 and loop 8 of BiBftA ΔAΔC-Fru; orange, BiBftA ΔAΔC-Fru; magenta, Fruf (i) and Frup (ii). (b) Stereo view of the active site of unliganded BiBftA ΔAΔC (blue) and BiBftA ΔAΔC-Fru (red). Fruf (i), Frup (ii), three catalytic residues (D100, D285, E377), and residues within 4 Å of Frup (ii) are shown