Figures & data

Table 1. Primer for qRT-PCR
Figure 1. Overexpressed lncRNA TUG1 could attenuate Lipopolysaccharide (LPS)-induced ARDS mice pulmonary inflammation. (a) Lung tissue histological observation and impairment was evaluated by Hematoxylin-eosin (H&E) staining, wMagnification: 200×, scale bar = 200 µm. (b) Lung permeability was evaulated by Evans blue dye extravasation. (c,d) The numbers of total cells and neutrophils in bronchoalveolar lavage fluid (BALF) was measured by hemocytometer. (e,f) The expressions of tumor necrosis factor-α (TNF-α) and Interleukin-1β (IL-1β) in BALF were determined by enzyme-linked immunosorbent assay (ELISA). (g) The expression of lncRNA TUG1 in mice lung tissues (n = 10) was detected by quantitative real-time polymerase chain reaction (qRT-PCR). β-actin was used as an internal control. All experiments have been performed in triplicate and experimental data were expressed as mean ± standard deviation (SD). (***P < 0.001, vs. Control; ##P < 0.01, ###P < 0.001, vs. LPS+NC) NC: negative control. ANOVA was applied followed by Student’s t-test
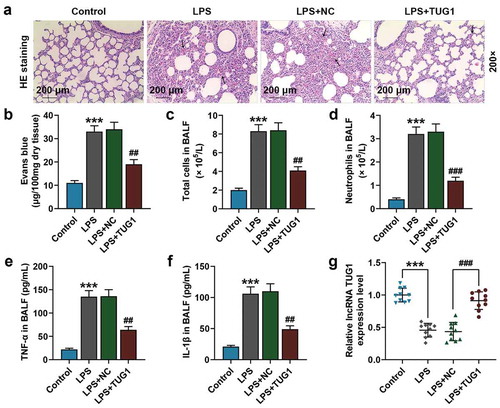
Figure 2. LncRNA TUG1 was a direct target of miR-221-3p, and could reduce miR-221-3p expression in ARDS mice model. (a) StarBase (www.starbase.sysu.edu.cn/) was used to predict the binding sites of miR-221-3p and lncRNA TUG1. (b) The RAW 264.7 macrophagocyte were co-transfected with wild-type or mutant of lncRNA TUG1 (TUG1-WT; TUG1-MUT) and miR-221-3p mimic, and luciferase activity was measured by dual-luciferase reporter assay. (c) The miR-221-3p expression in lung tissues (n = 10) from LPS-induced ARDS mice injected with lncRNA TUG1 overexpressed lentivirus was detected by qRT-PCR. U6 was used an internal control. All experiments have been performed in triplicate and experimental data were expressed as mean ± standard deviation (SD). (***P < 0.001, vs. Control; ###P < 0.001, vs. LPS+NC; ^^^P < 0.001, vs. MC) MC: mimic control, NC: negative control. ANOVA was applied followed by Student’s t-test
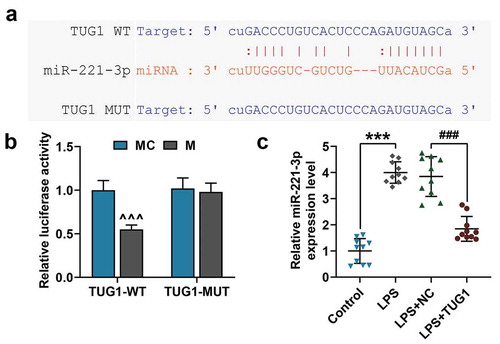
Figure 3. Overexpressed lncRNA TUG1 could alleviate LPS-induced up-regulation of miR-221-3p expression and RAW 264.7 macrophages apoptosis and inflammatory cytokines accumulation, which were reversed by overexpressed miR-221-3p. (a,b) RAW 264.7 macrophagocyte were divided into the following groups: Control, LPS, LPS+NC+mimic control, LPS+TUG1+ mimic control, LPS+NC+miR-221-3p, LPS+TUG1+ miR-221-3p. Expressions of lncRNA TUG1 and miR-221-3p in RAW 264.7 macrophages of each group were determined by qRT-PCR. β-actin and U6 were used as internal controls. (c) RAW 264.7 macrophages apoptosis rate in each group was detected by flow cytometry. (d,e) The expressions of inflammatory cytokines TNF-α and IL-1β in RAW 264.7 macrophages supernatant were detected by ELISA. All experiments have been performed in triplicate and experimental data were expressed as mean ± standard deviation (SD). (**P < 0.01, ***P < 0.001, vs. Control; #P < 0.05, ##P < 0.01, ###P < 0.001, vs. LPS+NC+MC; ^^P < 0.01, ^^^P < 0.01, vs. LPS+TUG1+ MC; &&P < 0.01, vs. LPS+NC+M). M: mimic, MC: mimic control, NC: negative control. ANOVA was applied followed by Student’s t-test
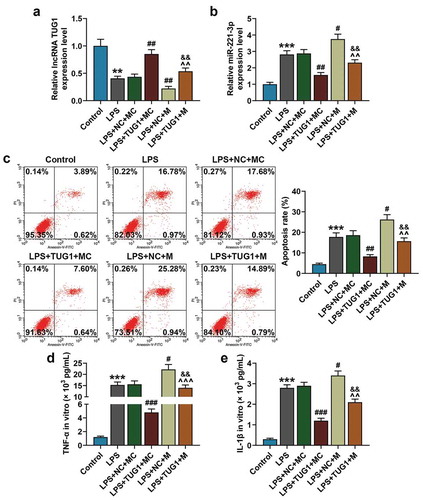
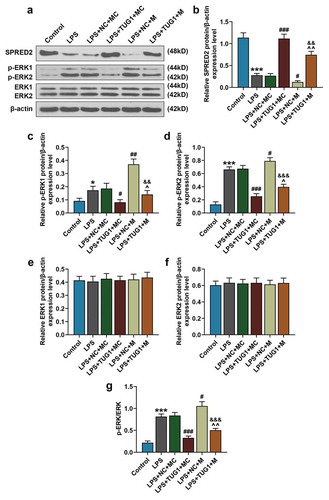
Figure 4. Overexpressed lncRNA TUG1 could up-regulate SPRED2 expression and down-regulate phosphorylation levels of ERK1 and ERK2, which were reversed by overexpressed miR-221-3p. (a-g) Expressions of SPRED2, phosphorylated (p)-ERK1/2 and ERK1/2 in RAW 264.7 macrophages were determined by Western blot. β-actin was used as an internal control. All experiments have been performed in triplicate and experimental data were expressed as mean ± standard deviation (SD). (*P < 0.05, ***P < 0.001, vs. Control; #P < 0.05, ##P < 0.01, ###P < 0.001, vs. LPS+NC+MC; ^P < 0.05, ^^P < 0.01, vs. LPS+TUG1+ MC; &&P < 0.01, &&&P < 0.001, vs. LPS+NC+M). M: mimic, MC: mimic control, NC: negative control, SPRED2: sprouty related EVH1 domain containing 2. ANOVA was applied followed by Student’s t-test