
Figures & data
Validation of candidate miRNAs and correlation analysis

Figure 1. Effects of burn injury on the expression of C5b9, LDH, TnI, and CK-MB in rat myocardial tissues. (a). III burn rat model was validated by H&E staining of skin. (b). The expression levels of C5b9, LDH, TnI, and CK-MB in the burn injury group were significantly upregulated.*p-value < 0.05, **p-value < 0.01
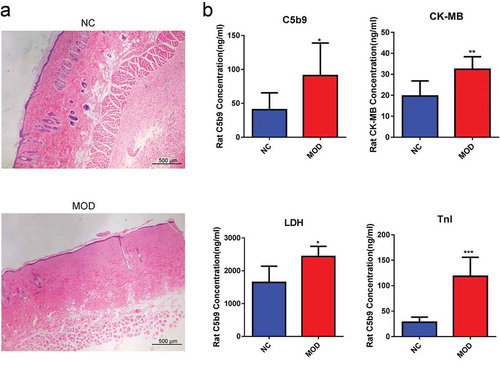
Table 1. Differentially expressed miRNAs in the normal group compared with the burn injury group
Figure 2. miRNA profiles in myocardial tissues of the normal group and burn injury group. PCA and cluster analyses were used, and the MOD6 sample was removed. Differential expression analysis was then performed. The value of |log2(fold change)| ≥ 1 and p-value < 0.05 were used as standards. A total of 23 differentially expressed miRNA were screened, of which 6 were significantly downregulated, and 17 were significantly upregulated in the burn injury group. (a). PCA analysis. (b). Cluster analysis. c. Heatmap. d. Scatterplot
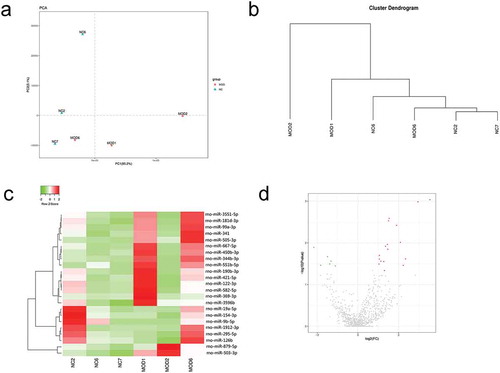
Figure 3. GO and KEGG enrichment analyses of differentially expressed miRNAs in the normal group compared with the burn injury group. Target mRNA of differentially expressed miRNAs were major enriched in BP category and CC category, in which metabolic process is the most important, and miRNA target genes are mainly enriched in PI3K/AKT, MAPK, Wnt, Rap1, and other signal pathways related to myocardial injury. (a). GO enrichment analysis. (b). KEGG enrichment analysis
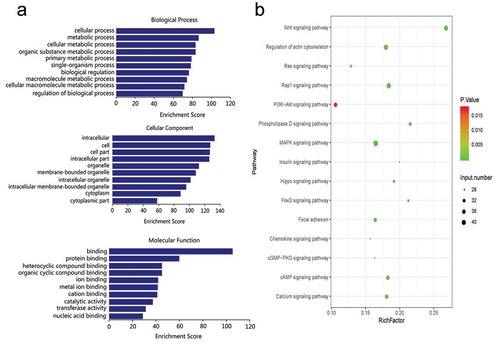
Figure 4. miRNA–mRNA interaction network of differentially expressed miRNAs in the normal group compared with the burn injury group. The miRNA–mRNA interaction network was constructed by targeting genes in 15 signaling pathways mapped by KEGG, and only 18 differentially expressed miRNA were selected in the network regulatory map. Red indicated the up-regulated miRNAs green indicated the down-regulated miRNAs, pink indicated the target mRNA
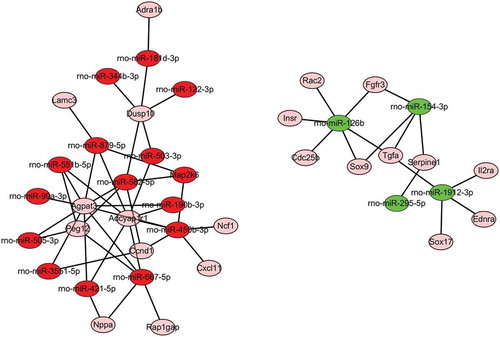
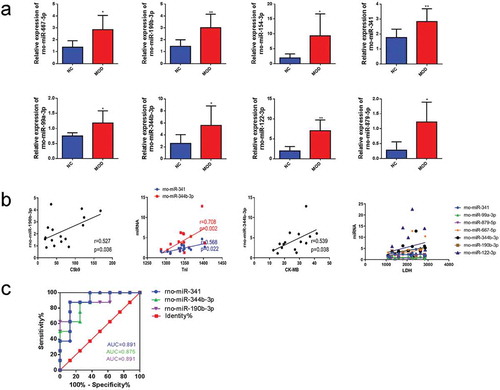
Figure 5. Validation of candidate miRNAs and correlation analysis. qRT-PCR of differentially expressed miRNAs in the tissues of normal group compared with the tissue of burn injury group. Pearson’s analysis was used to identify the correlation between miRNAs and C5b9, LDH, TnI, and CK-MB. Finally, through ROC curve analysis, the sensitivity of miRNAs related to C5b9, TnI, and CK-MB was evaluated as indicators of burn injury. (a). qRT-PCR identified the differentially expressed miRNAs in the burn injury group compared with the normal group. (b). Pearson’s analysis. c. ROC curves
Supplementary_Table_2.pdf
Download PDF (74.9 KB)Supplementary_Table_1.pdf
Download PDF (50.1 KB)Availability of data and materials
The datasets generated during and/or analyzed during the current study are available from the corresponding author on reasonable request.