Figures & data
Table 1. The composition of the nanofibers (NF7, NF10, and NF13).
Figure 1. Structures of the compounds in the plant extract.
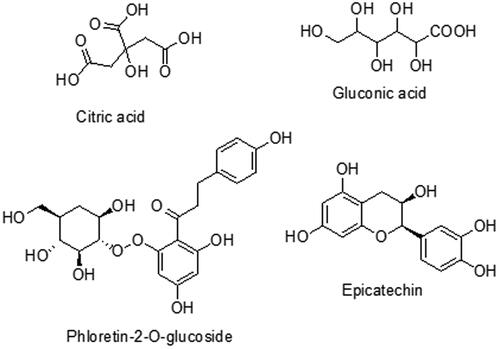
Figure 2. FTIR spectra of capparis sepiaria aqueous root extract, NF7, NF10, and NF13.
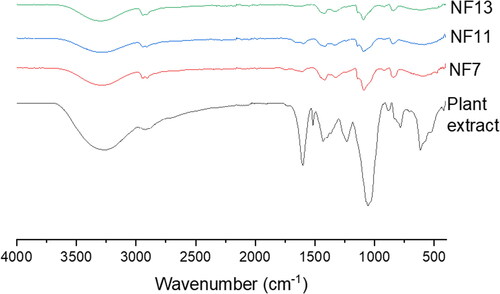
Table 2. Characteristic peaks present on the nanofibers FTIR spectra of NF7, NF10, NF13, and capparis sepieria extract.
Figure 3. SEM images (a) NF7 (b) NF10 and (c) NF13.
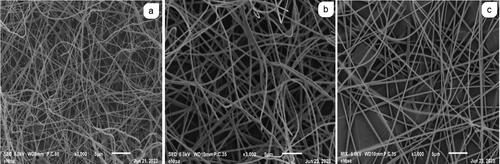
Figure 4. AFM images (a) NF7 and (b) NF13.
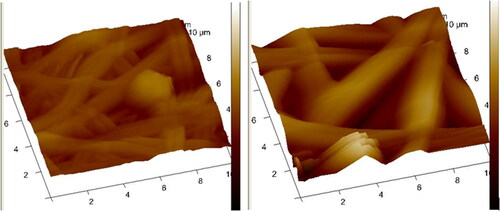
Table 3. Surface roughness parameters obtained from AFM analysis.
Table 4. WVTR of NF7, NF10, and NF13 nanofibers.
Table 5. Minimum inhibition concentration (MIC) values of the nanofibers against selected strains of bacteria.
Figure 5. In vitro % cell viability results of the nanofibers and controls at concentrations when treated on HaCaT (p < 0.05).
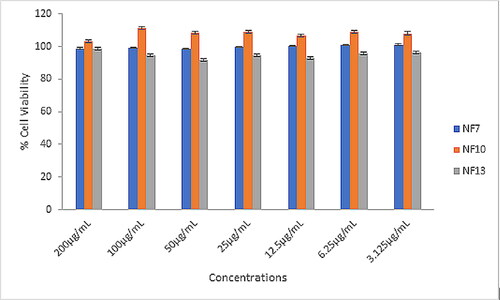
Figure 6. Wound scratch images for untreated cells, control, and NF10 for 0, 24, 48, 76, and 92 h.
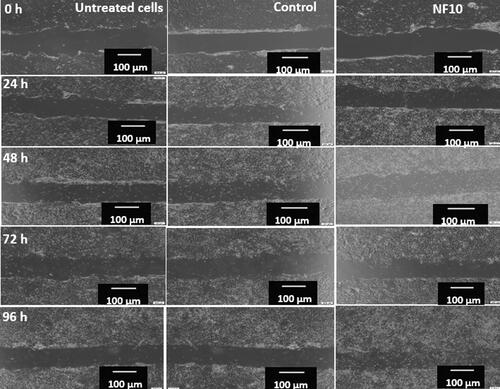
Table 6. In vitro wound scratch assay results for untreated, control, and NF10.
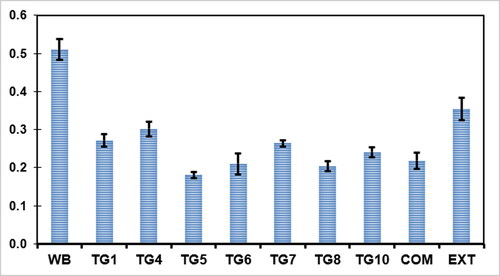
Figure 7. The absorbance of the nanofibers (NF7, NF10, and NF13), where, COM-commercial wound dressing, and EXT-Plant extract compared to the control WB-whole blood.