
Figures & data
Figure 1. Flow chart of the sampling process.
aThe “exluded middle” are schools that only moved from 4th to 3rd quartile.
bOne was bilingual, and one had a peculiar grading pattern.
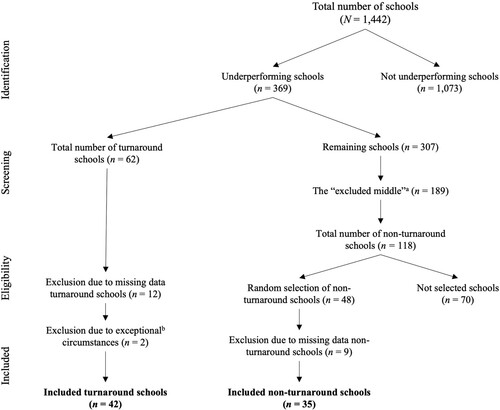
Table 1. Conditions summarised.
Figure 2. Distribution of causal conditions for turnaround and non-turnaround schools.
Note: HighAE = High Academic Expectations; SDQA = School District Quality Assurance.
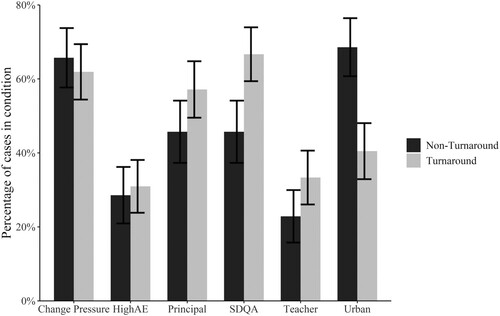
Table 2. Sufficient baseline solution sets (without contextual conditions).
Table 3. Sufficient baseline solution sets with contextual condition.
Table 4. Sufficient solutions for the urban/non-urban subsamples.
Table 5. Sufficient solutions for the negation of the outcome.
Table 6. Interviewed schools.
Supplemental Material
Download MS Word (300.5 KB)Data availability statement
Raw data are openly available at the Swedish National Agency for Education: https://www.skolverket.se/skolutveckling/statistik and https://www.skolverket.se/skolutveckling/statistik/salsa-statistisk-modell, the Swedish School Inspectorate https://www.skolinspektionen.se/beslut-rapporter-statistik/statistik/, and the Swedish Association of Local Authorities and Regions https://skr.se/skr/tjanster/kommunerochregioner/faktakommunerochregioner/kommungruppsindelning.2051.html