Figures & data
FIGURE 1. Average threshold (a) and macular integrity (b) results during the follow-up examinations for all eight subjects. Baseline examination was performed before the beginning of the treatment and the others during a follow-up period (M1 = 1 month, M3 = 3 months, and M6 = 6 months after the treatment). We observed no significant changes (p > .05) during 6-months follow-up
FIGURE 2. Regional and local analysis of eight subjects. Test grid, individual points, and point groups are shown in a diagram (a). It represent the distribution for the right eye. Left eye is represented by the mirror image. Individual (37) points were compared during the follow-up examinations (b) as well as points grouped in rings (c) for R1 (a single foveal point), R2 (points within 1º of eccentricity), R3 (points within 3º of eccentricity); R4 (points within 5º of eccentricity) and in quadrants (d) for Q1 (points placed at the superior quadrant), Q2 (points placed at the inferior quadrant), Q3 (points placed at the temporal quadrant), and Q4 (points placed at the nasal quadrant). Empty symbols represent results from the baseline, symbols with increasing darkness represent M1, M3, and M6 examinations, respectively. We observed no significant changes (p > .05) during 6-months of follow-up for all parameters analyzed
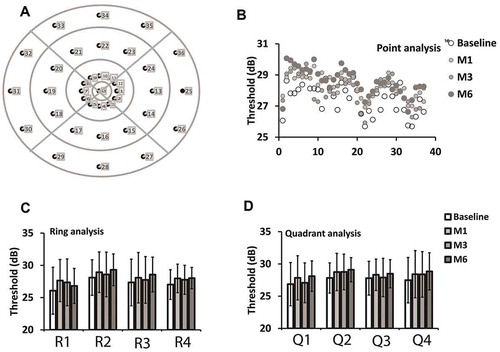
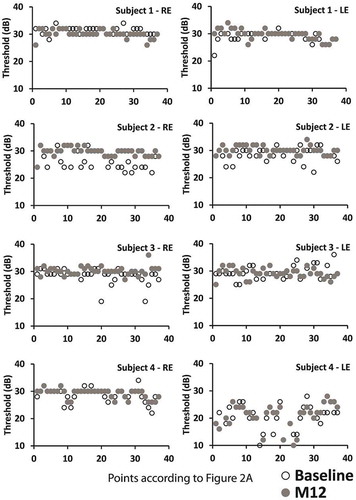
FIGURE 3. Point-by-point comparison of eight-paired (four subjects) eyes between baseline (empty symbols) and 12-month follow-up (gray symbols). Despite variability among subjects, we observed no significant changes (p > .05) during 6-months follow-up for all parameters analyzed