Figures & data
Table 1. The SUN Working Group Grading Scheme.
Figure 1. A representative screenshot of phase 1: The left side shows a single image to be graded, and the right side shows the grading scale (equivalent to the 1mm3 high power field in the SUN criteria). The grader is instructed to choose the grade that best represents the number of cells on the left image. Once a grade from the right side is chosen, the image is replaced automatically and the process repeated until the last image is graded.
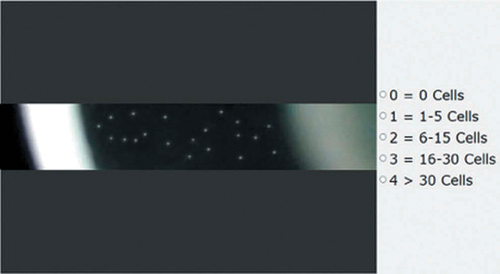
Table 2. Tarsier-Grading Image Scale (TGIS).
Figure 2. Screenshot from the second phase analysis: On the left side is a single image to be graded, and the right side shows the TGIS provided to the grader. The grader is instructed to click on one of the five images on the right side of the screen that best represents the number of cells on the left image. Once an image from the right side is chosen, the image is replaced.
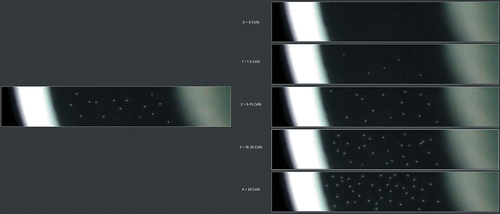
Table 3. Repeatability and reproducibility of clinician scores using the TGIS grading scale.
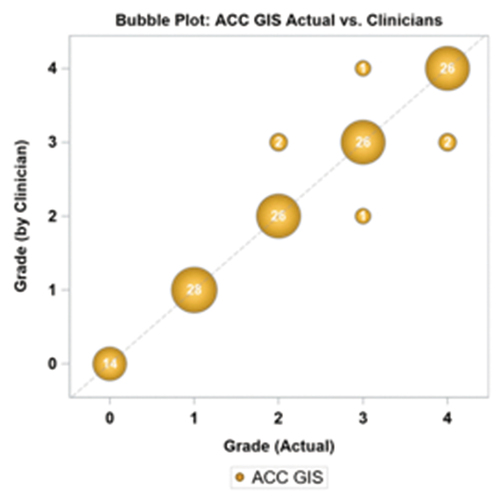
Figure 3. Bubble plot of actual ACC GIS score versus the clinician scores using the grading scale.
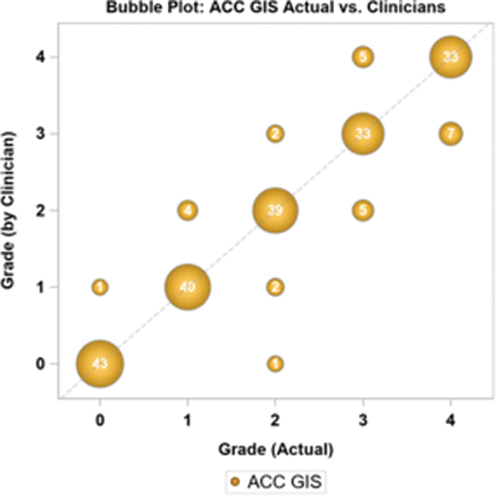
Table 4. Repeatability and reproducibility of clinician scores using the TGIS grading images.
Figure 4. Bubble plot of actual ACC TGIS score versus the clinician scores using the standardized image set.