
Figures & data
Figure 1. Patient selection.
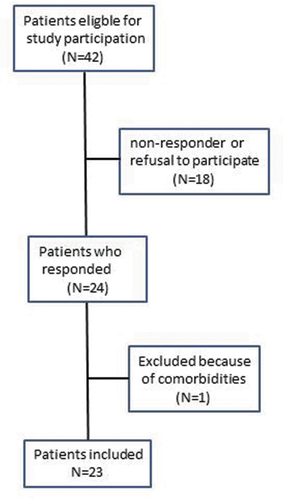
Table 1. Patient characteristics and outcome measurements compared to reference values.
Table 2. Ocular features.
Figure 2. Z-scores. The z-score represents the amount of standard deviations the value differs from the age and gender specific reference value. Values are presented as mean with 95% confidence interval.
Weight = weight for age, BMI = body mass index, Wpeak = peak work rate, Wpeak/kg = peak work rate per kg bodyweight, VO2peak = oxygen consumption at peak exercise, VO2peak/kg = oxygen consumption per kg bodyweight, Muscle strength = the sum of biceps, triceps, iliopsoas, and quadriceps muscles divided by eight as measured by hand-held dynamometry.
* Significant at p < .05 (see )
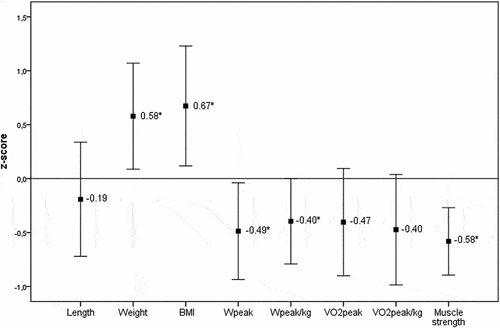
Table 3. Correlations.