
Figures & data
Figure 1. Principle of the use of cationic emulsion of CsA (CE-CsA) on the ocular surface. (a) Schematic structure of the CE-CsA and (b) interaction with the ocular surface.
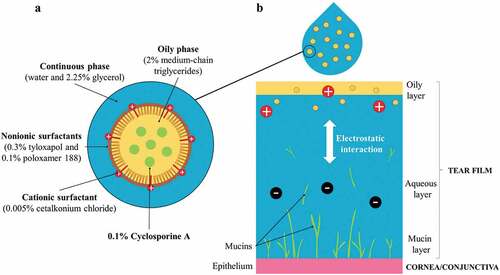
Table 1. Similarities between the composition of the tear film and a cationic emulsion.
Table 2. Overview of the pharmacodynamics studies realized on the CE-CsA.
Figure 2. Main outcomes regarding pharmacodynamics of CsA cationic emulsions. (a) Effects of the cationic emulsions of cetalkonium chloride (CE-CKC) emulsions, IKK Inhibitor X (IKK Inh X), dexamethasone (DXM), and cyclosporine A (CsA) on IL-6 and IL-8 release by HCE-2 cells following lipopolysaccharide (LPS) stimulation. *p < .05; **p < .01; ***p < .001.Citation55 (Adapted from reference Citation55). (b) Percentage of CFS score reduction after 10 days-treatment using 1% methylprednisolone (MePre), CE (CE-CsA veh) and CE-CsA on an in vivo mouse dry eye model. **p < .01; ***p < .001; ****p < .0001.Citation62 (Adapted from reference Citation62). (c) Wound closure from day 1 to day 3 after the different treatments. * p < .0001–0.02 compared to the other four groups at the corresponding times.Citation56 (Adapted from reference Citation56). (d) Fold changes and t-test values (vs. DED untreated) for the 23 genes detected among the 34 genes followed in this study in the DED (± treatment) mice corneas. (LE, loteprednol etabonate).Citation60 (Adapted from reference Citation60).
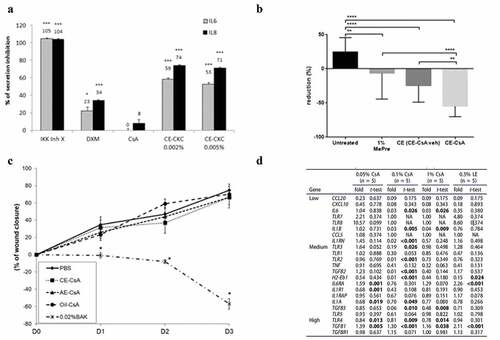
Table 3. Overview of the pharmacokinetics studies realized on the CE-CsA.
Figure 3. Main outcomes regarding pharmacokinetics of CE-CsA. (a) Changes in CsA concentration with time after a single unilateral topical administration in the cornea of pigmented rabbits.Citation74 (Adapted from reference Citation74). (b) Pharmacokinetics profile of CsA delivery after a single unilateral topical administration of CE-CsA or CsA hospital-compounded preparations (CsA-HP) in the cornea and conjunctiva of pigmented rabbits.
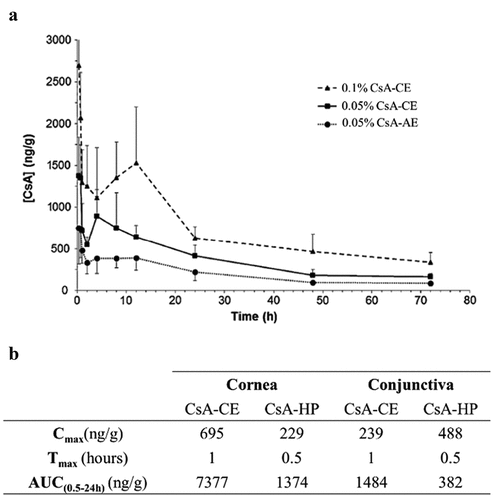
Table 4. Overview of the ocular toxicity and tolerance studies realized on the CE-CsA.
Figure 4. Main outcomes regarding ocular toxicity and tolerance of CE-CsA. (a) Microphotographs of typical clinical features of rabbit eyes after 15 instillations at 5-min interval of 0.002% CKC or 0.02% BAK containing in a solution (sol) or a CE.Citation75 (b) Draize test score calculated at different time points (75 min, 4h and 1 day) after 15 instillations of CE-CsA, AE-CsA, Oil-CsA or 0.02% BAK. * p < .02 compared to PBS and p < .004 compared to 0.02% BAK. # p < .01 compared to AE-CsA, Oil-CsA, and 0.02% BAK. ♦ p < .0001 compared to PBS. $ p = .0003 compared to PBS, CE-CsA, AE-CsA, and Oil-CsA groups.Citation56 (Adapted from reference Citation56).
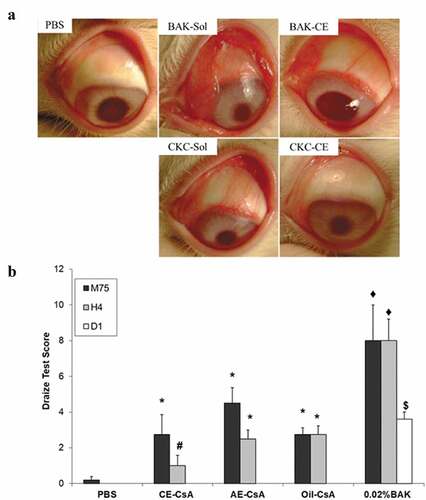
Table 5. Similarities between preclinical outcomes and results of clinical studies.