3,119
Views
92
CrossRef citations to date
0
Altmetric
ORIGINAL PAPER

Final Report of the Early vs. Late Infantile Strabismus Surgery Study (ELISSS), a Controlled, Prospective, Multicenter Study

, &
Pages 169-199 | Accepted 01 Oct 2005, Published online: 08 Jul 2009

Figures & data

FIGURE 1 Patient recruitment over time. Straight interrupted line: target recruitment. Striated line: early group, Continuous line: late group.
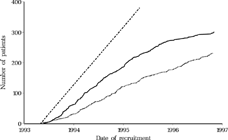
FIGURE 1 Patient recruitment over time. Straight interrupted line: target recruitment. Striated line: early group, Continuous line: late group.

FIGURE 2 Number of recruited and dropout children per clinic. White: to be operated early, Black: to be operated late, Striated: dropout.

FIGURE 2 Number of recruited and dropout children per clinic. White: to be operated early, Black: to be operated late, Striated: dropout.

FIGURE 3 Intervals between successive examinations of all children who underwent the final examination.
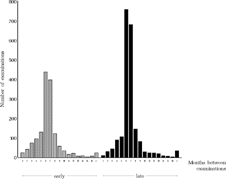
FIGURE 3 Intervals between successive examinations of all children who underwent the final examination.

FIGURE 4 Patient flow chart.

FIGURE 4 Patient flow chart.

FIGURE 5 Reported age (months) at onset of strabismus for all patients who underwent the final examination, stratified according to whether the children had been operated (black) or not (white) at age six.
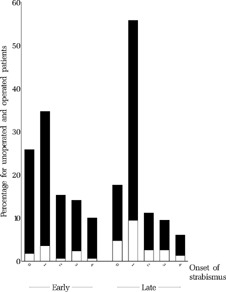
FIGURE 5 Reported age (months) at onset of strabismus for all patients who underwent the final examination, stratified according to whether the children had been operated (black) or not (white) at age six.

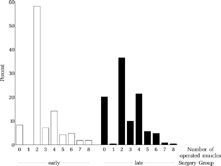
FIGURE 6 Number of operations. 8.2% from the early group and 20.1% from the late group had not been operated at age six. Among the children operated upon two or three times, only a few were operated upon for consecutive divergence (black), although consecutive divergence occurred frequently (). One child from the early group was operated upon twice for consecutive divergence (striated).
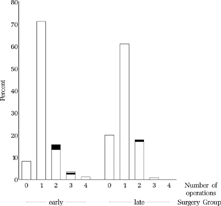
FIGURE 6 Number of operations. 8.2% from the early group and 20.1% from the late group had not been operated at age six. Among the children operated upon two or three times, only a few were operated upon for consecutive divergence (black), although consecutive divergence occurred frequently (Fig. 25). One child from the early group was operated upon twice for consecutive divergence (striated).

FIGURE 7 Number of operated muscles per child.

FIGURE 7 Number of operated muscles per child.

FIGURE 8 Age (years) at first surgery. Dots: scheduled for early surgery, Circles: scheduled for late surgery.
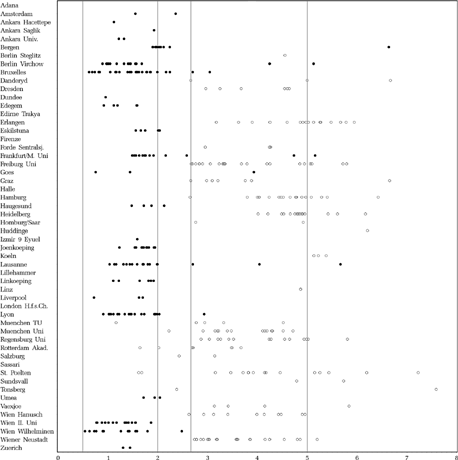
FIGURE 8 Age (years) at first surgery. Dots: scheduled for early surgery, Circles: scheduled for late surgery.

FIGURE 9 Age at final examination. Dots: early surgery, Circles: late surgery.

FIGURE 9 Age at final examination. Dots: early surgery, Circles: late surgery.

FIGURE 10 Age (months) at entry examination for all operated (black) and unoperated (white) patients who underwent the final examination. Mean age at entry examination was 11.1 SD 3.7 months in the early group and 10.9 SD 3.7 months in the late group.

FIGURE 10 Age (months) at entry examination for all operated (black) and unoperated (white) patients who underwent the final examination. Mean age at entry examination was 11.1 SD 3.7 months in the early group and 10.9 SD 3.7 months in the late group.

FIGURE 12 Baseline spherical equivalent (averaged and rounded) at approx. 11 months for all operated (black) and unoperated (white) patients who underwent the final examination.
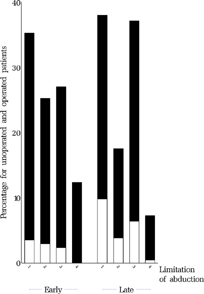
FIGURE 12 Baseline spherical equivalent (averaged and rounded) at approx. 11 months for all operated (black) and unoperated (white) patients who underwent the final examination.
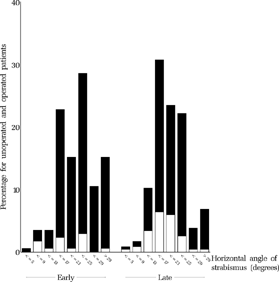
FIGURE 14 Baseline angle of strabismus at approx. 11 months for all operated (black) and unoperated (white) patients who underwent the final examination.

FIGURE 14 Baseline angle of strabismus at approx. 11 months for all operated (black) and unoperated (white) patients who underwent the final examination.

FIGURE 16 Baseline degree of amblyopia at approx. 11 months for all operated (black) and unoperated (white) patients who underwent the final examination. Categories: (1) cross-fixation or alternating freely, (2) preference of fixation, (3) failure to maintain fixation, (4) poor fixation behavior and eccentric fixation in fundus, (5) poor fixation behavior and far eccentric fixation.
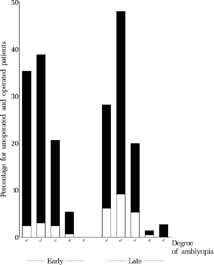
FIGURE 16 Baseline degree of amblyopia at approx. 11 months for all operated (black) and unoperated (white) patients who underwent the final examination. Categories: (1) cross-fixation or alternating freely, (2) preference of fixation, (3) failure to maintain fixation, (4) poor fixation behavior and eccentric fixation in fundus, (5) poor fixation behavior and far eccentric fixation.

FIGURE 18 Baseline limitation of abduction at approx. 11 months for all operated (black) and unoperated (white) patients who underwent the final examination. Categories: (1) free abduction, using pursuit, (2) free abduction, using doll's-head, (3) passing midline but not free, (4) not passing midline.

FIGURE 18 Baseline limitation of abduction at approx. 11 months for all operated (black) and unoperated (white) patients who underwent the final examination. Categories: (1) free abduction, using pursuit, (2) free abduction, using doll's-head, (3) passing midline but not free, (4) not passing midline.

FIGURE 11 Relationship between age at entry examination and outcome at age six: binocular vision (left upper panel), angle of strabismus (upper right), relative acuity (lower left) and absolute acuity (lower right) of the amblyopic eye. Although no primary endpoint, visual acuity of the worse eye has been added in a fourth scatter plot because there was a large variation of the visual acuity of the better eye. For more easy comparison, the same linear scale has been used for the ordinate in the latter two scatter plots. For level of binocular vision, see Methods or legends of .
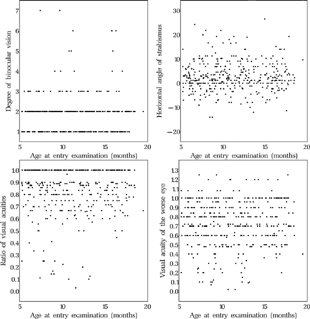
FIGURE 11 Relationship between age at entry examination and outcome at age six: binocular vision (left upper panel), angle of strabismus (upper right), relative acuity (lower left) and absolute acuity (lower right) of the amblyopic eye. Although no primary endpoint, visual acuity of the worse eye has been added in a fourth scatter plot because there was a large variation of the visual acuity of the better eye. For more easy comparison, the same linear scale has been used for the ordinate in the latter two scatter plots. For level of binocular vision, see Methods or legends of Fig. 22.

FIGURE 13 Relationship between baseline angle of strabismus at approx. 11 months and outcome at age six.
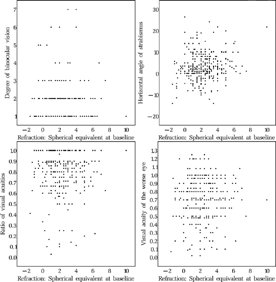
FIGURE 13 Relationship between baseline angle of strabismus at approx. 11 months and outcome at age six.

FIGURE 15 Relationship between baseline angle of strabismus at approx. 11 months and outcome at age six.

FIGURE 15 Relationship between baseline angle of strabismus at approx. 11 months and outcome at age six.

FIGURE 17 Relationship between baseline degree of amblyopia at approx. 11 months and outcome at age six. For the categories of amblyopia, see in Methods or the legend to .

FIGURE 17 Relationship between baseline degree of amblyopia at approx. 11 months and outcome at age six. For the categories of amblyopia, see in Methods or the legend to Fig. 16.

FIGURE 19 Relationship between baseline limitation of abduction at approx. 11 months and outcome at age six. For the categories of limitation of adduction, see in Methods or the legend to .
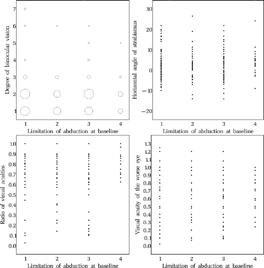
FIGURE 19 Relationship between baseline limitation of abduction at approx. 11 months and outcome at age six. For the categories of limitation of adduction, see in Methods or the legend to Fig. 18.

FIGURE 22 Level of binocular vision at the final examination. It was significantly better in the early group than in the late group (p = 0.001). Categories: (1) Bagolini negative, (2) Bagolini positive, (3) Housefly positive, (4) Titmus circles 200″ to 140″, (5) Titmus circles 100″ to 40″, (6) all figures of Lang Test or TNO 480″ & 240″, (7) TNO 120″–15″.

FIGURE 22 Level of binocular vision at the final examination. It was significantly better in the early group than in the late group (p = 0.001). Categories: (1) Bagolini negative, (2) Bagolini positive, (3) Housefly positive, (4) Titmus circles 200″ to 140″, (5) Titmus circles 100″ to 40″, (6) all figures of Lang Test or TNO 480″ & 240″, (7) TNO 120″–15″.

TABLE 1 Relationship Between Potentially Prognostic Baseline Parameter's (left) and Primary Endpoints (top)—Spearman's Rank Correlation Coefficients (rs) Including Corresponding p-Values.

TABLE 2 Potentially Prognostic Baseline Parameters Measured at Baseline—Differences Between Dropouts and Completers.

FIGURE 20 Relationship between mean level of binocular vision at age six and mean dropout rate per clinic. Dots: early surgery, Circles: late surgery. For the level of binocular vision, see in Methods or the legends to .

FIGURE 20 Relationship between mean level of binocular vision at age six and mean dropout rate per clinic. Dots: early surgery, Circles: late surgery. For the level of binocular vision, see in Methods or the legends to Fig. 22.

FIGURE 21 Relationship between mean level of binocular vision at age six and number of recruited children per clinic. Dots: early surgery, Circles: late surgery. For the level of binocular vision, see in Methods or the legend to .

FIGURE 21 Relationship between mean level of binocular vision at age six and number of recruited children per clinic. Dots: early surgery, Circles: late surgery. For the level of binocular vision, see in Methods or the legend to Fig. 22.

TABLE 3 Mean and Median Level of Binocular Vision at the Final Examination. For Levels of Binocular Vision, See in Methods, the Legend to or .

TABLE 4 Level of Binocular Vision—Frequencies of Categories.

FIGURE 23 Age at first operation vs. level of binocular vision at the final examination, for all children operated once or repeatedly. For the level of binocular vision, see in Methods or the legend to .

FIGURE 23 Age at first operation vs. level of binocular vision at the final examination, for all children operated once or repeatedly. For the level of binocular vision, see in Methods or the legend to Fig. 22.

FIGURE 24 Relation between level of binocular vision and angle of strabismus at distance fixation. Black dots represent the patients who had not been operated at age six.

FIGURE 24 Relation between level of binocular vision and angle of strabismus at distance fixation. Black dots represent the patients who had not been operated at age six.

TABLE 5 Lising of All Patients (3.0% in the Early and 3.9% in the Late Group) Who Attained Stereopsis Beyond Housefly Positive at the Final Examination.

TABLE 6 Classified Angle of Strabismus: Frequency of Classes.

FIGURE 25 Horizontal angle of strabismus for both groups at the final examination at age six. The angle at baseline at approx. 11 months for the same group of children is shown in .

FIGURE 25 Horizontal angle of strabismus for both groups at the final examination at age six. The angle at baseline at approx. 11 months for the same group of children is shown in Fig. 14.

FIGURE 26 Ratio of the visual acuity of the worse eye divided by that of the better eye.

FIGURE 26 Ratio of the visual acuity of the worse eye divided by that of the better eye.

FIGURE 27 Visual acuity of the amblyopic eye at age six. The degree of amblyopia at the entry examination is shown for the same group of children in .

FIGURE 27 Visual acuity of the amblyopic eye at age six. The degree of amblyopia at the entry examination is shown for the same group of children in Fig. 16.

TABLE 7 Ratio of the Visual Acuities (Worse Eye Relative to Better Eye).

TABLE 8 Visual Acuity of the Better and of the Worse Eye. The Average Values of the Visual Acuities are Not Logarithmic Averages But, Due to the Nature of the Statistical Test, the p-Value Remains the Same If Logarithmic Values are Taken.

TABLE 9 ‘As Treated’ Analysis: Level of Binocular Vision (Frequencies of Categories).

TABLE 10 ‘As Treated’ Analysis: Classified Angle of Strabismus (Frequencies of Categories).

TABLE 11 ‘As Treated’ Analysis: Ratio of the Visual Acuities.

TABLE 12 DVD-Rate vs. Horizontal Angle of Strabismus.

TABLE 13 Faden Surgery: Level of Binocular Vision (Frequencies of Categories).

Reprints and Corporate Permissions

Please note: Selecting permissions does not provide access to the full text of the article, please see our help page How do I view content?

To request a reprint or corporate permissions for this article, please click on the relevant link below:

Academic Permissions

Please note: Selecting permissions does not provide access to the full text of the article, please see our help page How do I view content?

Obtain permissions instantly via Rightslink by clicking on the button below:

If you are unable to obtain permissions via Rightslink, please complete and submit this Permissions form. For more information, please visit our Permissions help page.