
Figures & data
Figure 1. Microperimetry results report of an initial MAIA assessment. The top-left image shows SLO of the fundus, and the top-right image shows combined SLO with SAP. The retinal sensitivity is color co-ordinated and measured in dB and the TRL is identified in blue as the Fixation Training Target (FTT). The bottom-left image identifies the 63% BCEA shown as the smaller purple ring and the larger purple ring represents 95% BCEA. Fixation stability P1 and P2 values are identified in along a normative colored scale.
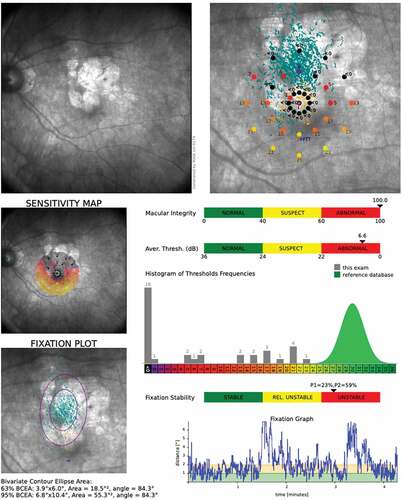
Figure 2. Progression of fixation training. The patient’s fixation parameters are identified as P1 (green circle), P2 (yellow circle), 63% BCEA (smaller purple circle) and 95% BCEA (larger purple circle). Image a represents fixation at the start of training and image b demonstrates the fixation progress toward the end of the training. Also note the TRL location is highly reproducible throughout the training.
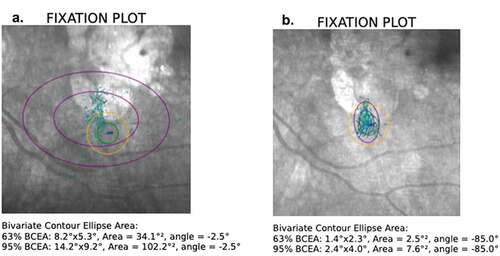
Table 1. Mean, SD and statistical outcome of visual function parameters.
Figure 3. Mean P1 and P2 at baseline and post-treatment.
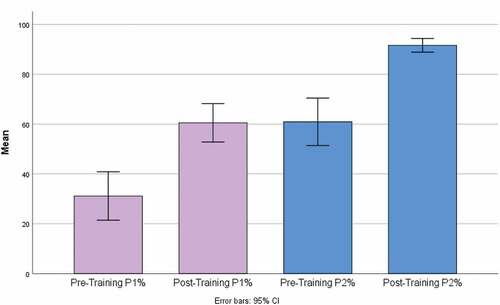
Figure 4. Mean 63% and 95% BCEA at baseline and post-treatment.
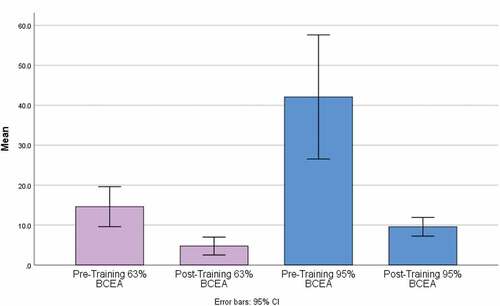
Table 2. Correlations between visual function parameters.