
Figures & data
Table 1. Age and sex distribution of participants, Global Trachoma Mapping Project, Katsina State, Nigeria, 2014.
Table 2. Local government area (LGA)-level prevalence of trachomatous inflammation–follicular (TF) and trichiasis, Global Trachoma Mapping Project, Katsina State, Nigeria, 2014.
Figure 1. Prevalence of active trachoma (trachomatous inflammation–follicular, TF) in 1–9-years-olds in Katsina State, Nigeria, 2014.
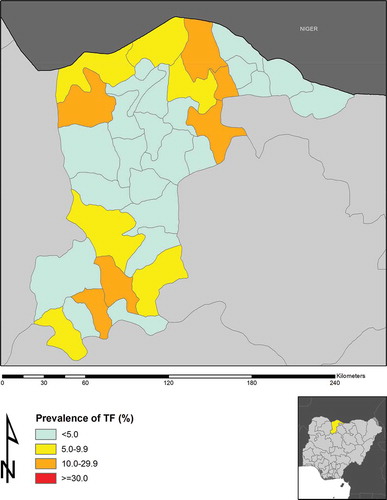
Figure 2. Prevalence of trichiasis in ≥15-year-olds in Katsina State, Nigeria, 2014.
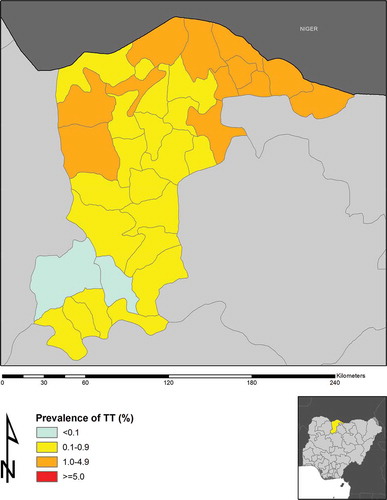
Table 3. Local government area (LGA)-level estimates of trichiasis surgery backlog, Global Trachoma Mapping Project, Katsina State, Nigeria, 2014.
Table 4. Household access to wash water and improved latrines, Global Trachoma Mapping Project, Katsina State, Nigeria, 2014.
Table 5. SAFE strategy (surgery, antibiotics, facial cleanliness, environmental improvement) activities required to be implemented to eliminate trachoma in each local government area (LGA) of Katsina State, Nigeria, 2014.