
Figures & data
Table 1. Age and sex distribution of participants, Global Trachoma Mapping Project, Bauchi State, Nigeria, 2013–2014.
Table 2. Local government area-level prevalences of trachomatous inflammation – follicular (TF) and trichiasis, Global Trachoma Mapping Project, Bauchi State, Nigeria, 2013–2014.
Figure 1. Prevalence of trachomatous inflammation – follicular (TF) in 1–9-year-old children, by local government area, Global Trachoma Mapping Project, Bauchi State, Nigeria, 2013–2014.
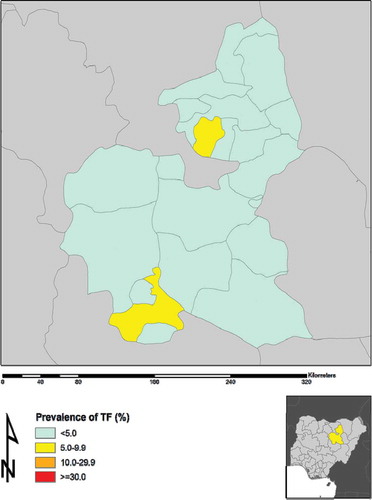
Figure 2. Prevalence of trichiasis in adults ≥15 years, by local government area, Global Trachoma Mapping Project, Bauchi State, Nigeria, 2013–2014.
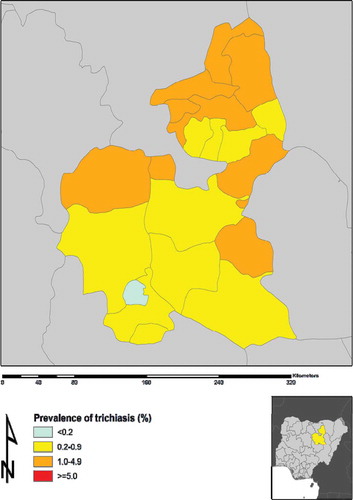
Table 3. Local government area-level estimates of trichiasis surgery backlog, Global Trachoma Mapping Project, Bauchi State, Nigeria, 2013–2014.
Table 4. Household access to washing water and improved latrines, by local government area, Global Trachoma Mapping Project, Bauchi State, Nigeria, 2013–2014.