Figures & data
Table 1. Districts selected for the first two phases of trachoma mapping in Zimbabwe, 2014–2015.
Table 2. Sampling by district, Global Trachoma Mapping Project, Zimbabwe, 2014–2015.
Table 3. Examination results, Global Trachoma Mapping Project, Zimbabwe, 2014–2015.
Table 4. Estimated population-level prevalence of trachomatous inflammation–follicular (TF) in children aged 1–9 years by district, Global Trachoma Mapping Project, Zimbabwe, 2014–2015.
Table 5. Recommendations for implementation of components of the SAFE strategy based on prevalence of trachomatous–inflammation follicular (TF) and trichiasis, Zimbabwe, 2014–2015.
Table 6. Estimated population-level prevalence of trichiasis and estimated trichiasis surgery backlogs by district, Global Trachoma Mapping Project, Zimbabwe, 2014–2015.
Table 7. Multilevel univariable associations with trachomatous inflammation–follicular (TF) in children aged 1–9 years, Global Trachoma Mapping Project, Zimbabwe, 2014–2015.
Table 8. Independent predictors of trachomatous inflammation–follicular (TF) in children aged 1–9 years, Global Trachoma Mapping Project, Zimbabwe, 2014–2015.
Figure 1. Estimated prevalence of trachomatous inflammation–follicular (TF) among children aged 1–9 years, by district, Global Trachoma Mapping Project, Zimbabwe, 2014–2015.
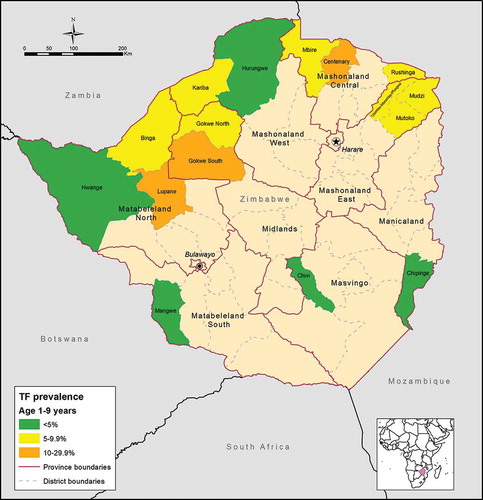
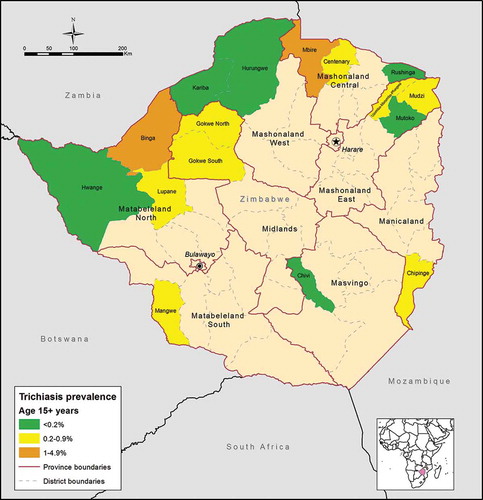
Figure 2. Adjusted prevalence of trichiasis in adults aged 15 years or greater, by district, Global Trachoma Mapping Project, Zimbabwe, 2014–2015.