
Figures & data
Table 1. Numbers of enumerated individuals examined, who refused examination or were absent, and adjusted trachoma prevalences, by Area Council, Federal Capital Territory, Nigeria, Global Trachoma Mapping Project, 2014. (TF = trachomatous inflammation—follicular; TI = trachomatous inflammation—intense).
Figure 1. Prevalence of trachomatous inflammation-follicular (TF) in 1–9-year-old children, by Area Council, Federal Capital Territory, Nigeria, Global Trachoma Mapping Project, 2014.
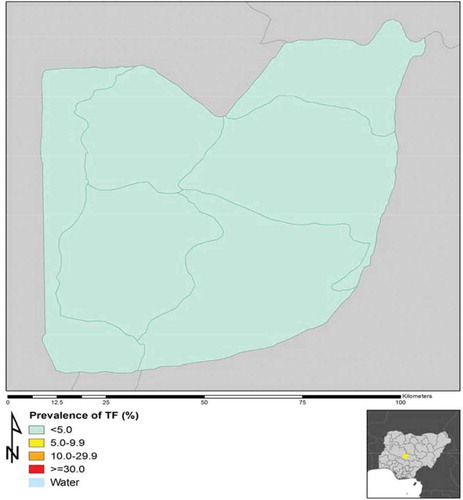
Figure 2. Prevalence of trichiasis in adults, by Area Council, Federal Capital Territory, Nigeria, Global Trachoma Mapping Project, 2014.
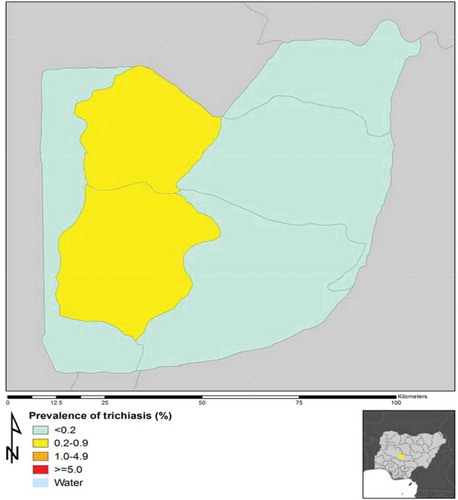
Table 2. Household-level water and sanitation coverage by Area Council, Federal Capital Territory, Nigeria, Global Trachoma Mapping Project, 2014.
Table 3. Recommended actions by Area Council, Federal Capital Territory, Nigeria, Global Trachoma Mapping Project, 2014.