Figures & data
Figure 1. Evaluation units for trachoma surveys, Global Trachoma Mapping Project, Somali Region, Ethiopia, 2013. Woredas and administrative zones are labelled.
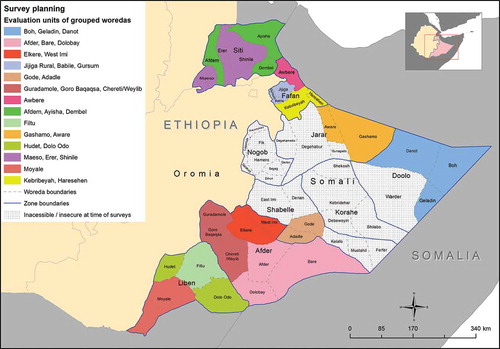
Table 1. Age and sex distribution of enumerated individuals, Global Trachoma Mapping Project, Somali Region, Ethiopia, 2013.
Table 2. Prevalence of trachomatous inflammation–follicular (TF) and trachomatous inflammation–intense (TI) among children aged 1–9 years, Global Trachoma Mapping Project, Somali Region, Ethiopia, 2013.
Figure 2. Age-specific prevalences of trachomatous inflammation–follicular (TF) and trachomatous inflammation–intense (TI) in children aged 1–9 years, Global Trachoma Mapping Project, Somali Region, Ethiopia, 2013.
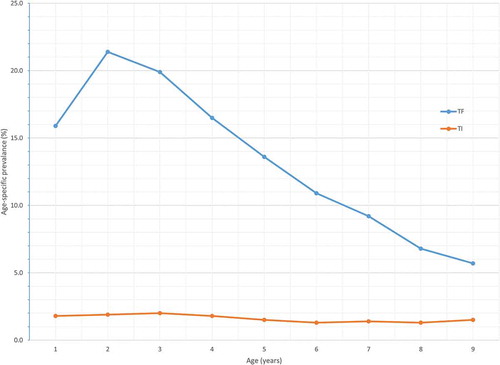
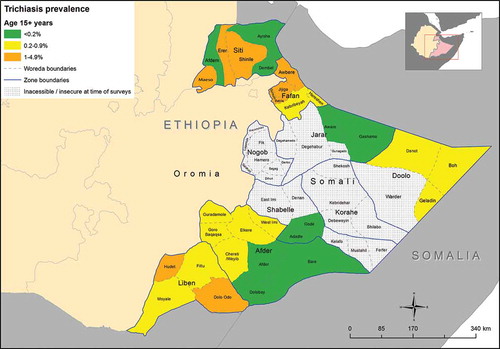
Table 3. Prevalence of trichiasis among adults aged over 15 years, Global Trachoma Mapping Project, Somali Region, Ethiopia, 2013.
Figure 3. Prevalence of trachomatous inflammation–follicular (TF) in children aged 1–9 years, Global Trachoma Mapping Project, Somali Region, Ethiopia, 2013.
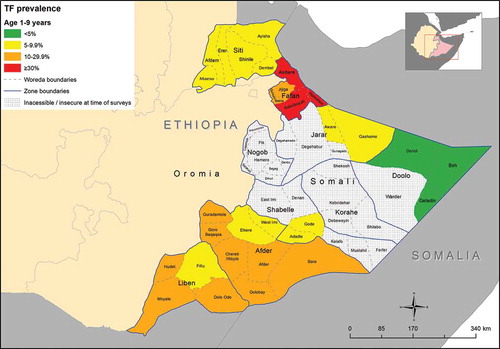
Figure 4. Prevalence of trichiasis among adults aged over 15 years, Global Trachoma Mapping Project, Somali Region, Ethiopia, 2013.