
Figures & data
Figure 2. Local government areas for trachoma impact surveys, Kebbi, Sokoto and Zamfara States, Nigeria, 2014–2016.
Table 1. Results of 15 selected baseline trachoma prevalence surveys conducted from 2004 to 2006, and consequent public health-level actions, Kebbi, Sokoto and Zamfara States, NigeriaCitation14,Citation15,unpublished data.
Figure 1. Number of rounds of antibiotic mass drug administration (MDA) for trachoma, Kebbi, Sokoto and Zamfara States, Nigeria, 2010–2013.
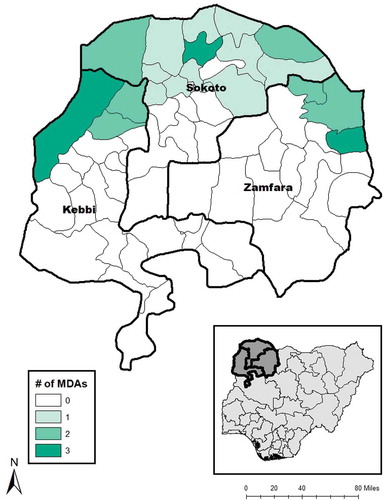
Table 2. Enumeration and examination characteristics of sampled individuals in 15 local government areas, impact surveys for trachoma, Kebbi, Sokoto and Zamfara States, Nigeria, 2014–2016.
Table 3. Prevalence of trachomatous inflammation—follicular (TF) and trichiasis or trachomatous trichiasis (TT) at baseline and impact surveys, 15 local government areas of Kebbi, Sokoto and Zamfara States, Nigeria.
Table 4. Prevalence of trachomatous inflammation—follicular (TF) and trachomatous trichiasis (TT), impact surveys, four sub-districts of Arewa local government area, Kebbi State, Nigeria, 2014.
Table 5. Number of individuals with trichiasis, number of individuals with trichiasis + trachomatous conjunctival scarring (a combination referred to here as trachomatous trichiasis, TT: see text) and prevalence of each of these things, impact surveys, 15 local government areas (LGAs) of Kebbi, Sokoto and Zamfara States, Nigeria, 2014–2016.
Table 6. Household access to water and improved sanitation facilities, 15 local government areas of Kebbi, Sokoto and Zamfara States, Nigeria, 2014–2016.