Figures & data
Figure 1. The map showing the study location.
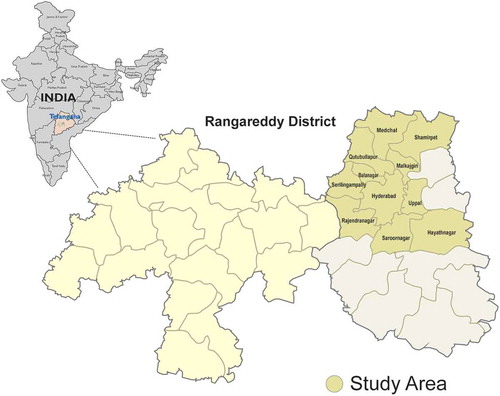
Table 1. Sample size calculations for various cluster sizes, expected prevalence of visual impaiment (VI) and number of people with VI in the sample.
Table 2. Study questionnaires used in the HOMES project.
Table 3. Results of the reliability study.
Figure 2. Flowchart showing the sequence of eye examination.