
Figures & data
Table 1. Demographic characteristics of the study participants.
Figure 1. Flow diagram of participants who were enrolled in the cohort study.
Figure 2. Presentation of patients with MK, by month in 2017 (n = 261). Monthly average minimum and maximum temperatures, average humidity and the number of days with rain are overlaid. Humidity was in percentage but was scaled to tens (divided by 10) to fit on the plot scale.
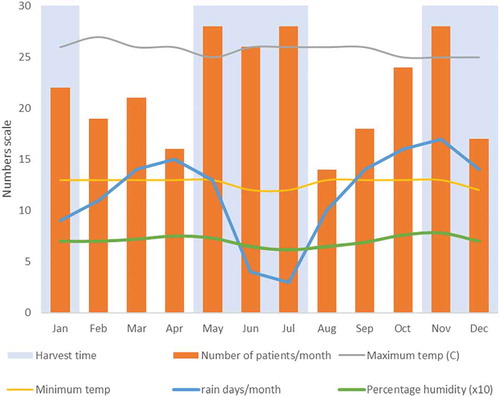
Table 2. Clinical history.
Table 3. Clinical features and diagnosis at presentation (n = 313).
Table 4. Outcomes at 3 months.
Table 5. Causal modeling for poor presenting vision (n = 313).
Figure 3. A DAG framework showing the causal pathways for poor presenting vision. This diagram is adjusted to illustrate the role of TEM. The solid lines indicate hypothesized direct relationships and the dashed lines indicate hypothesized indirect relationships.
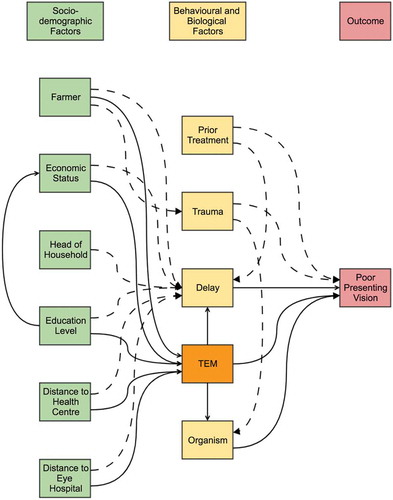
Table 6. Factors at presentation predictive of a poor final visual acuity (WHO snellen ordinal scale) at 3 months (n = 260).