Figures & data
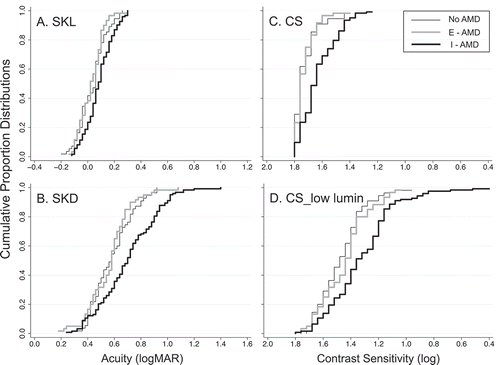
Figure 1. Cumulative proportion distributions for SKL (panel A), SKD (panel B), CS (panel C), and CS_low lumin (panel D) for eyes categorized as No-AMD (thin black line), E-AMD (thick grey line) and I-AMD (thick black line). Data are plotted with poorer performance to the right along the abscissa. All scales are in log units and x-axes span 1.6 log units. Abbreviations: SKL = SKILL Light: high contrast near acuity; SKD = SKILL Dark: low contrast, low luminance near acuity; CS = contrast sensitivity at high luminance; CS_low lumin = contrast sensitivity at low photopic luminance

Table 1. Fundus Characteristics of the 237 Eyes of 125 People Included in the Baseline (BL) Sample
Table 2. Baseline Demographic and Vision Measure Summary for AMD Categories
Figure 2. Cumulative proportion distributions for SDH (panel A), DesatCCS (panel B), IReST (panel C), and Glare Recovery (panel D) for No-AMD (thin black line), E-AMD (thick grey line), and I-AMD (thick black line). Data are plotted with poorer performance to the right along the abscissa. All scales are in log units and x-axes span 1.6 log units. For DesatCCS, IReST, and Glare Recovery, the displayed range of non-log values is noted in the lower right corner of each panel. Abbreviations: SDH = shape discrimination hyperacuity; DesatCCS = desaturated D-15 color confusion score; IReST = International Reading Speed Test

Table 3. Multinomial Logistic Regression with General Estimating Equation (GEE) Analysis of the Association between Vision Variables for I-AMD vs. E-AMD
Table 4. Multinomial Logistic Regression with General Estimating Equation (GEE) Analysis of the Association between Vision Variables for I-AMD vs. No-AMD
