Figures & data
Table 1. Protocol employed, population enumerated and participants examined in trachoma impact surveys, Oromia Region, Ethiopia, February 2017− March 2020. Individual evaluation unit (EU)-level data are shown in Supplementary Table 1.
Table 2. Age-adjusted prevalence of trachomatous inflammation—follicular (TF) in 1–9-year-olds at trachoma impact surveys in Oromia Region, Ethiopia, February 2017− March 2020. Individual evaluation unit (EU)-level data are shown in Supplementary Table 2.
Table 3. Age-and gender-adjusted prevalence of trachomatous trichiasis (TT) unknown to the health system in people aged ≥15 years in Oromia Region, Ethiopia, February 2017− March 2020.
Table 4. Zone-level summaries of proportion of households surveyed with access to improved drinking water facilities and latrines in 131 trachoma impact surveys in Oromia Region, Ethiopia, February 2017− March 2020. Individual evaluation unit (EU)-level data are shown in Supplementary Table 5.
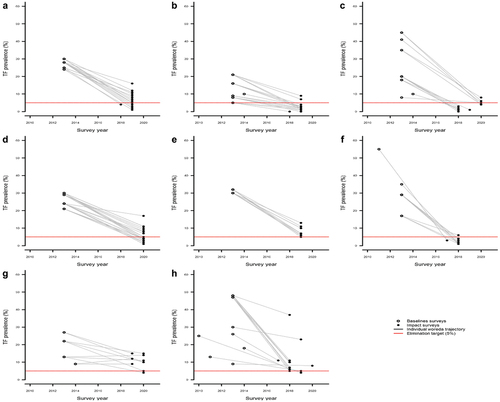
Figure 1. Prevalence of trachomatous inflammation—follicular (TF) among 1–9-year-old children at baseline surveys (2010) and at impact surveys (2017–2020), Oromia Region, Ethiopia.