
Figures & data
Figure 1. Annual trend of incidence rates (per 10,000) of ocular injuries in relation to gender, age group, and service branch in service members of the U.S. Armed Force from 2016 to 2019 (error bars are 95% confidence interval).
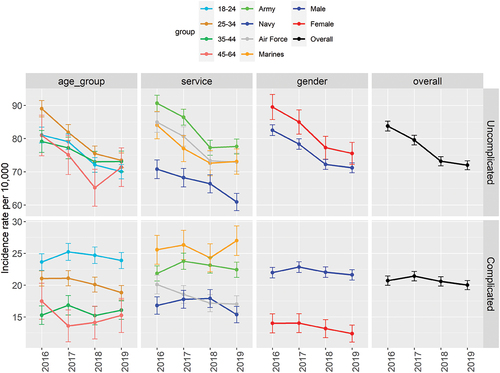
Table 1. Estimates of relative risk by multivariate Poisson regression model of incidence rates of ocular injury (the references for gender, age group and service branch are female, age group 18–24, and Air Force, respectively).
Figure 2. Geospatial distribution of the total numbers of ocular injuries in service members of the U.S. Armed Force by zip codes of military treatment facilities in the Continental U.S.
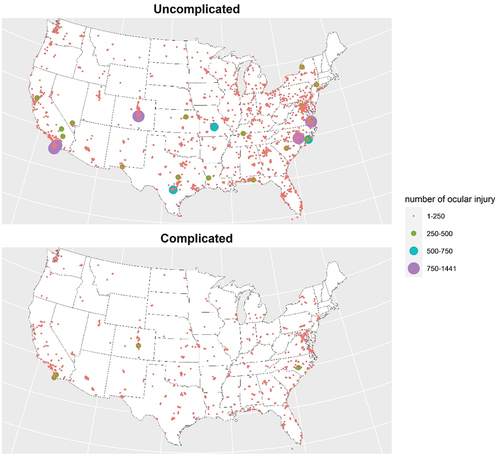
Table 2. The number of ocular injuries associated with external causes.
Table 3. Number of ocular injury for occupations (in decreasing order in occurrence) in active duty members of the U.S. Armed Forces during 2016–2019.