Figures & data
Figure 1. Adjusted prevalence of trachomatous inflammation–follicular (TF) in Kenya. Counties coloured in white were not surveyed. The boundaries and names indicated and the designations used on this map do not imply the expression of any opinion of any kind on the part of the authors, or the institutions with which they are affiliated, concerning the legal status of a country, territory, city or region or its authorities, or concerning the delimitation of its borders.
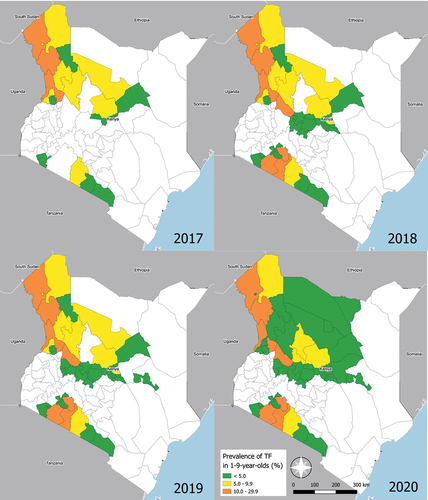
Figure 2. Prevalence of trachomatous inflammation–follicular (TF) in children aged 1–9 years in Kenya. Prevalence data from 2004 are published elsewhere.Citation10 data from 2010–2014 were taken from unpublished reports of programmatic activities. The horizontal red line indicates the 5% TF threshold. To ensure the prevalence estimates are clearly visible, the precision of each estimate is not illustrated on this plot.
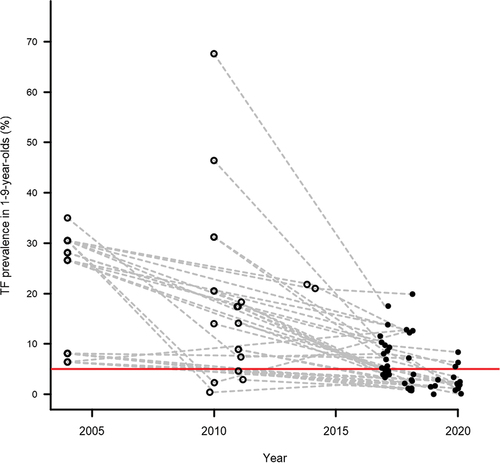
Figure 3. Adjusted prevalence of trachomatous trichiasis (TT) unknown to the health system in Kenya. Where more than one survey took place over the study period (April 2017–December 2020), only the most recent result is shown. Counties coloured in white were not surveyed. The boundaries and names indicated and the designations used on this map do not imply the expression of any opinion of any kind on the part of the authors, or the institutions with which they are affiliated, concerning the legal status of a country, territory, city or region or its authorities, or concerning the delimitation of its borders.
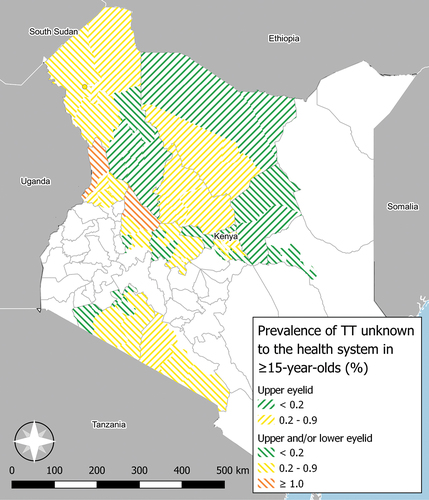
Figure 4. Age-specific trichiasis prevalence, separated by gender and whether the individual reported having been offered management in at least one affected eye. A. Data from 774 trichiasis cases identified during population-based prevalence surveys for trachoma in Kenya from 2017–2019. B. Data from 172 trichiasis cases identified during population-based prevalence surveys for trachoma in Kenya in 2020. F= female; M = male.
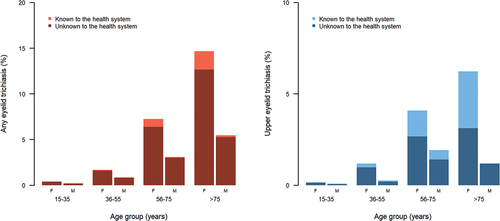
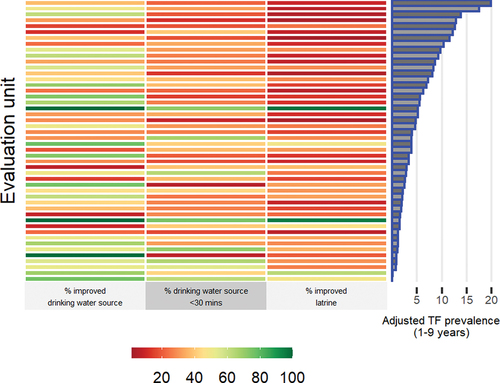
Figure 5. Proportion of households in each surveyed evaluation unit with access to improved water source and sanitation facilities, ordered by adjusted trachomatous inflammation–follicular (TF) prevalence in children aged 1–9 years. Data collected during trachoma surveys in Kenya, April 2017−December 2020.