1,376
Views
30
CrossRef citations to date
0
Altmetric
Articles

Circadian expressions of cardiac ion channel genes in mouse might be associated with the central clock in the SCN but not the peripheral clock in the heart

, , , , , , & show all
Pages 519-530 | Received 05 Apr 2012, Accepted 13 Jun 2012, Published online: 06 Aug 2012

Figures & data

Figure 1. Confirmation of the successful suprachiasmatic nucleus (SCN) lesion. (A) Sham-operated mice: Substantial circadian rhythms in the heart rate and body temperature were observed. (B) SCN-lesioned mice: The arrow indicates the date that the SCN was lesioned. The SCN lesion was considered successful if the loss of circadian rhythms of heart rate and body temperature persisted for more than 14 days.
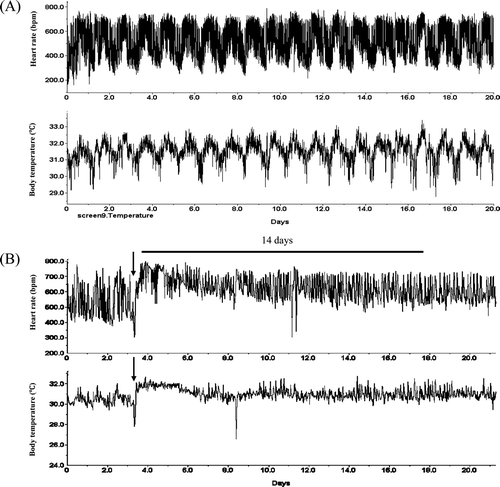
Figure 1. Confirmation of the successful suprachiasmatic nucleus (SCN) lesion. (A) Sham-operated mice: Substantial circadian rhythms in the heart rate and body temperature were observed. (B) SCN-lesioned mice: The arrow indicates the date that the SCN was lesioned. The SCN lesion was considered successful if the loss of circadian rhythms of heart rate and body temperature persisted for more than 14 days.

Table 1. Sequences of PCR primers and sequence-specific probes.

Figure 2. Influence of SCNX and ANSB on the mRNA level of clock genes in the mouse heart (for each group, n = 3-6). Clock gene expressions in the atrium (A) and ventricle (B). All data were normalized against GAPDH and double-plotted. The solid line or dotted line indicates circadian rhythm fitted by least-squares cosine-curve fitting. Open diamonds, Bmal1 expression; open circles and closed triangles, Per2; closed squares, Dbp. The open and closed bars under the x-axis represent the light and dark periods, respectively, in one day. The expression of all of the clock genes lost circadian rhythm in the SCNX group and was dampened significantly in the ANSB group. ANSB, autonomic nervous system block; SCNX, suprachiasmatic nucleus lesioned.
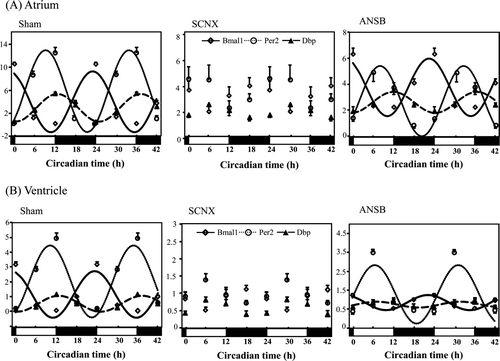
Figure 2. Influence of SCNX and ANSB on the mRNA level of clock genes in the mouse heart (for each group, n = 3-6). Clock gene expressions in the atrium (A) and ventricle (B). All data were normalized against GAPDH and double-plotted. The solid line or dotted line indicates circadian rhythm fitted by least-squares cosine-curve fitting. Open diamonds, Bmal1 expression; open circles and closed triangles, Per2; closed squares, Dbp. The open and closed bars under the x-axis represent the light and dark periods, respectively, in one day. The expression of all of the clock genes lost circadian rhythm in the SCNX group and was dampened significantly in the ANSB group. ANSB, autonomic nervous system block; SCNX, suprachiasmatic nucleus lesioned.

Table 2. Clock gene expressions in the mouse heart.

Figure 3. Cardiac ion channel genes expressions were similarly altered in the SCNX and ANSB mice (for each group, n = 3–6). Cardiac ion channel genes expressions in the atrium (A) and ventricle (B). All data were normalized against GAPDH and double-plotted. The solid line or dotted line indicates circadian rhythm fitted by least-squares cosine-curve fitting. Open diamonds, KCNA5; closed triangles, KCND2; open squares, KCHIP2; open circles, KCNK3. The open and closed bars under the x-axis represent the light and dark periods, respectively, in one day. All four ion channel gene expressions lost circadian rhythm in the SCNX and ANSB mice.
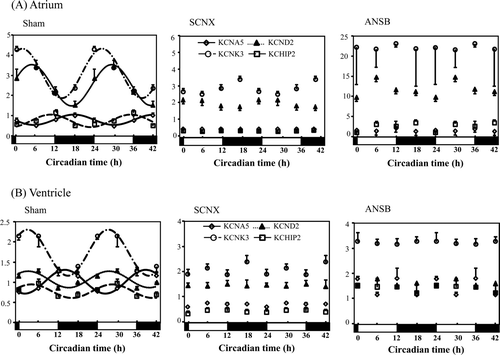
Figure 3. Cardiac ion channel genes expressions were similarly altered in the SCNX and ANSB mice (for each group, n = 3–6). Cardiac ion channel genes expressions in the atrium (A) and ventricle (B). All data were normalized against GAPDH and double-plotted. The solid line or dotted line indicates circadian rhythm fitted by least-squares cosine-curve fitting. Open diamonds, KCNA5; closed triangles, KCND2; open squares, KCHIP2; open circles, KCNK3. The open and closed bars under the x-axis represent the light and dark periods, respectively, in one day. All four ion channel gene expressions lost circadian rhythm in the SCNX and ANSB mice.

Table 3. Cardiac ion channel gene expressions in the mouse heart.

Figure 4. Heart rate and QT interval lost circadian rhythm in both SCNX and ANSB mice (for each group, n = 3–6). Heart rate (beats per min) and QT interval (ms) were recorded every 6 h and analysed by the least-squares cosine-curve fitting. The solid line indicates circadian rhythm fitted by least-squares cosine-curve fitting. Open circles, sham-operated mice; open triangles, ANSB mice; closed squares, SCNX mice. The open and closed bars under the x-axis represent the light and dark periods, respectively, in one day. The heart rate lost circadian rhythm in both SCNX and ANSB mice. The mean heart rate in the SCNX mice was significantly higher than that in the ANSB mice.
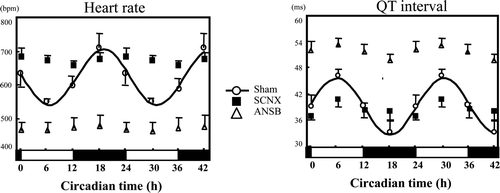
Figure 4. Heart rate and QT interval lost circadian rhythm in both SCNX and ANSB mice (for each group, n = 3–6). Heart rate (beats per min) and QT interval (ms) were recorded every 6 h and analysed by the least-squares cosine-curve fitting. The solid line indicates circadian rhythm fitted by least-squares cosine-curve fitting. Open circles, sham-operated mice; open triangles, ANSB mice; closed squares, SCNX mice. The open and closed bars under the x-axis represent the light and dark periods, respectively, in one day. The heart rate lost circadian rhythm in both SCNX and ANSB mice. The mean heart rate in the SCNX mice was significantly higher than that in the ANSB mice.

Table 4. Heart rate and QT interval.