Figures & data
Figure 1. PER2::LUC expression rhythm effects on MEFs. (A) Representative de-trended data for cells treated with 0.1% DMSO as a vehicle or with 4DMNob (1–30 μM). (B) Effect of each treatment on the period length of the rhythmic PER2::LUC expression. (C) Effect of each treatment on PER2::LUC bioluminescence amplitude of peak 1. Data are presented as means ± SEM (n = 4). * p < 0.05, versus vehicle (one-way ANOVA with Tukey’s multiple comparison test). # p < 0.05, ## p < 0.01 (Kruskal–Wallis test with Dunn’s multiple comparison test).
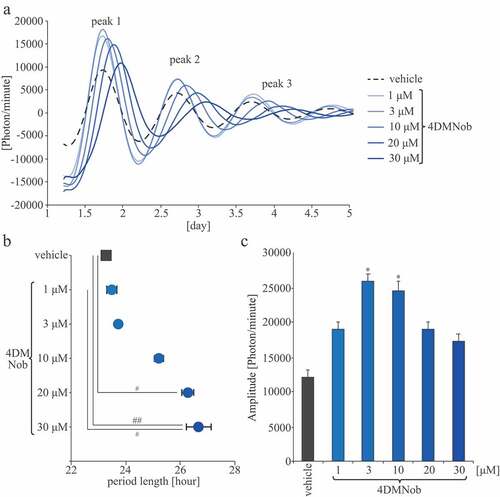
Figure 2. The effects of FCR on the locomotor activity levels and the free-running period length of the locomotor activity rhythm. (A) Representative double-plotted actograms for mice fed with HFD (the HFD group) or with HFD supplemented with 0.257% FCR (the HFD+FCR group). The horizontal lines indicate the local time and the vertical lines indicate the passing day. The gray shadow on the actograms indicates the dark period. (B) The locomotor activity rhythm under LD condition. We averaged the locomotor activity rhythm for 7 days. Open and closed bars indicate light and dark periods, respectively. (C) The average of total locomotor activity levels for 7 days in both groups under LD condition. (D) The average percentage of activity levels during the active period under LD condition. (E) The free-running period of locomotor activity rhythm was analyzed for all days during DD condition. Data are presented as means ± SEM (n = 5). * p < 0.05 vs the HFD group (t-test with FDR multiple testing correction). $ p < 0.05 (Mann Whitney test).
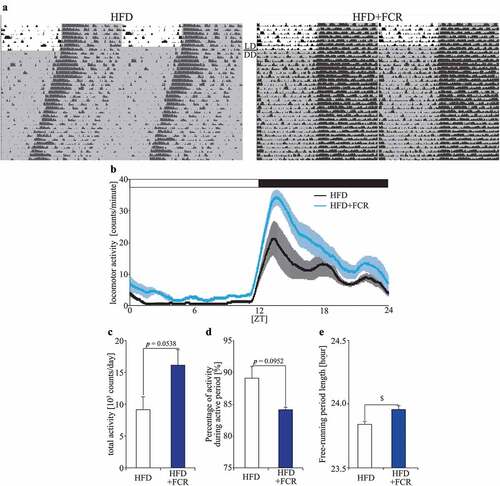
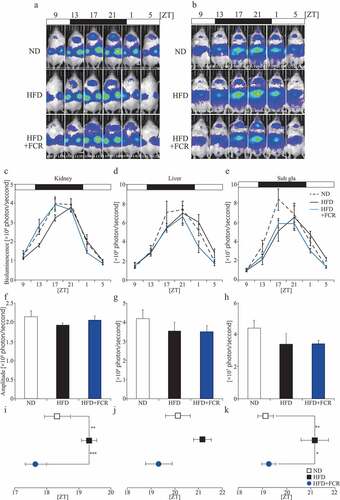
Figure 3. The effects of FCR on PER2::LUC expression rhythm in peripheral organs. Representative images (A and B), analyzed waveforms (C–E), amplitudes (F–H), and peak phases (I–K) of in vivo PER2::LUC bioluminescence. Open and closed bars indicate light and dark periods, respectively. Data are presented as the mean ± SEM (the ND and HFD+FCR groups, n = 6; the HFD group, n = 5). * p < 0.05, ** p < 0.01 (one-way ANOVA with Tukey’s multiple comparison test).