
Figures & data
Figure 1. Selection process.
Table 1. Participant characteristics.
Table 2. Test statistics of the measures across DMDD and ODD.
Figure 2. Social cognition score distributions.
Note. Based on raw data. Percentile ranks < 26% are indicative of clinical scores (i.e., below expected/norm levels). Scaled scores have a mean of 10 and a standard deviation of 3. Scaled scores < 8 are indicative of clinical scores.
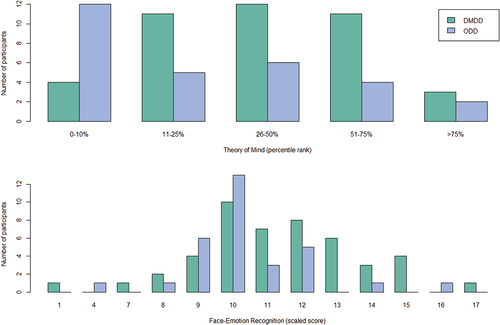
Figure 3. Executive functions scaled score distributions.
Note. Based on raw data. Scaled scores have a mean of 10 and a standard deviation of 3. Scaled scores < 8 are indicative of clinical scores.
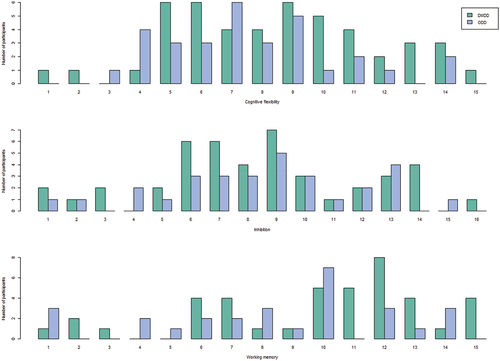
Table 3. Correlations between variables in DMDD and ODD.
Figure 4. Regression model in children with DMDD with coefficients.
Note. Squared boxes = Raw values. Rounded boxes = Computed scores. Dependent Variable: CBCL Social Problems. Social Cognition = Combined NEPSY-2 Theory of Mind and Face-emotion Recognition score. Executive Function = Combined NEPSY-2 Shift, Inhibition and Working Memory score. Circular arrows = Social Cognition*Executive Function interaction variable. Results from raw data are in parentheses. *p < .05.
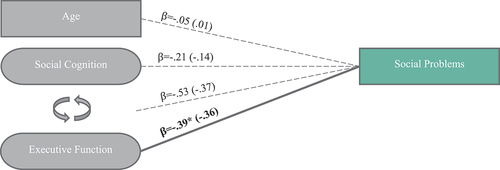
Figure 5. Interaction effect of executive function and social cognition on social problems in children with ODD.
Note. Using raw data.
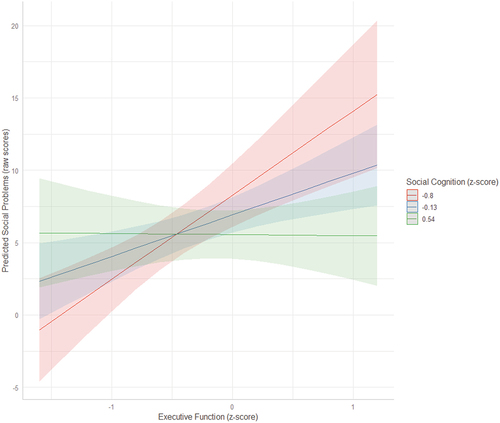
Figure 6. Regression model in children with ODD with coefficients.
Note. Squared boxes = Raw values. Rounded boxes = Computed scores. Dependent Variable: CBCL Social Problems. Social Cognition = Combined NEPSY-2 Theory of Mind and Face-emotion Recognition score. Executive Function = Combined NEPSY-2 Shift, Inhibition and Working Memory score. Circular arrows = Social Cognition*Executive Function interaction variable. Results from raw data are in parentheses. *p < .05. **p < .01.
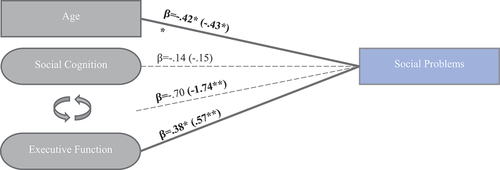
Table 4. Regression analyses predicting CBCL social problems.
Supplemental material