Figures & data
Figure 1. Conceptual model of the present study.
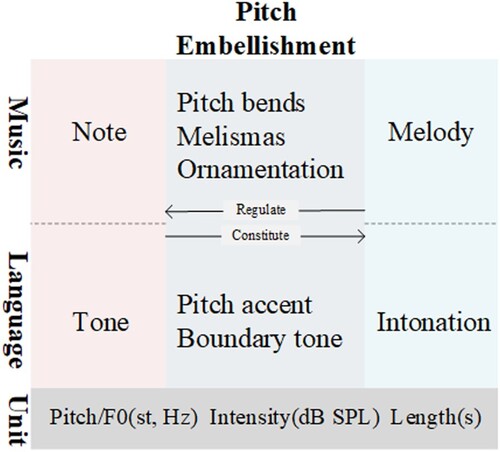
Figure 2. Correlation between Mandarin tones and Zhao Yuanren’s musical composition concept.
Table 1. Basic Information about the songs and poems included in the New Poetry Collection.
Table 2. Application details.
Figure 3. Schematic diagram of the research process.
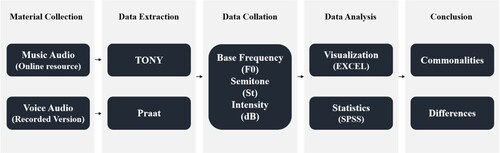
Figure 4. Number of adjacent interval steps in Audio10. A bar chart of the count analysis for Audio 10#s’ adjacent interval in the Appendix. Smaller intervals dominate the musical melody.
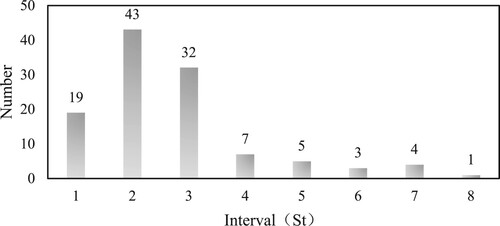
Table 3. Voice and music information for Audio #10.
Figure 5. Histogram of frequency statistics of adjacent st in the music (A) and speech (B) audio.
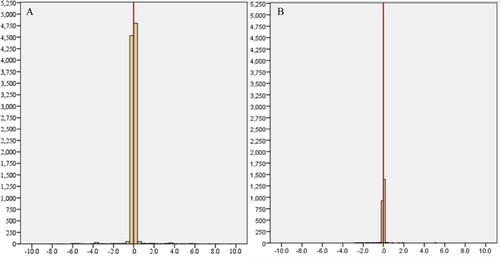
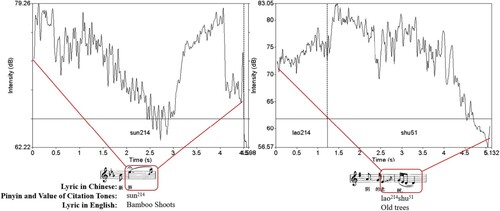
Table 4. Voice and music information for Audio #2.
Figure 6. Scatter diagram of the voice recitation’s melodic contour in Audio #2.
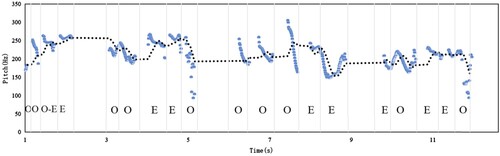
Figure 7. Scatter diagram of singing pitch’s melodic contour in Audio #2.
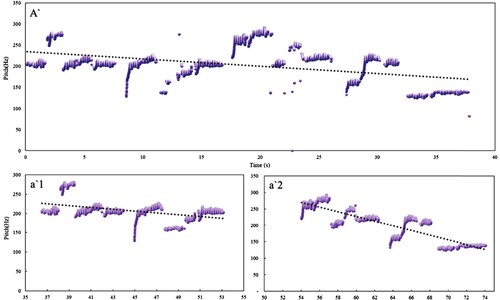
Table 5. #2 Curved structure diagram.
Figure 8. Final sentence voice F0 line of #1 (declarative intonation).
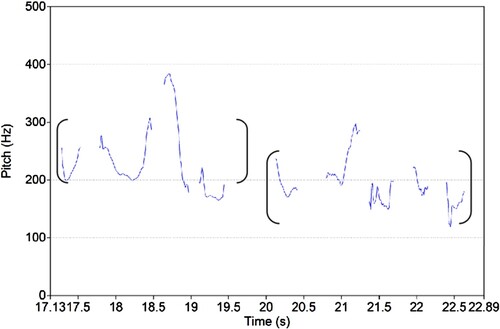
Figure 9. Final sentence voice F0 line of #1 (yes-no interrogative intonation).
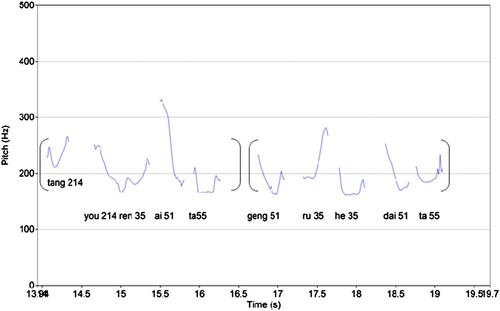
Figure 10. The score excerpt of Song #1 final phrase.
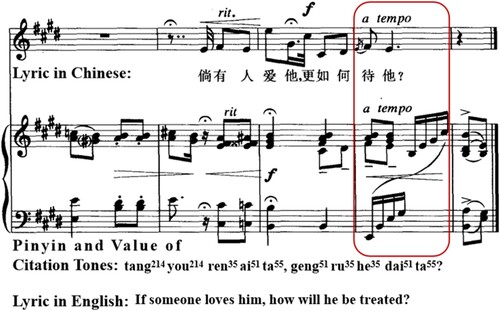
Figure 11. Comparison of the F0 of Song #4 selection’s singing (A) and voice(B) melody.
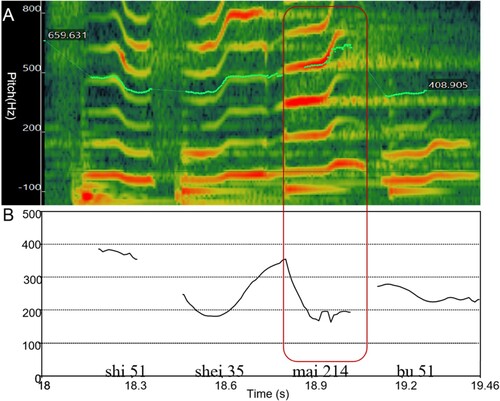
Figure 12. The score excerpt of Song #13.
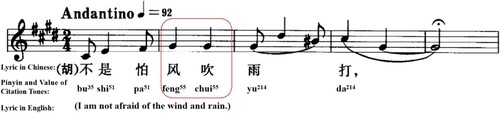
Figure 13. Melodic F0 curve for the word ‘身影’ appearing twice in Song #14.
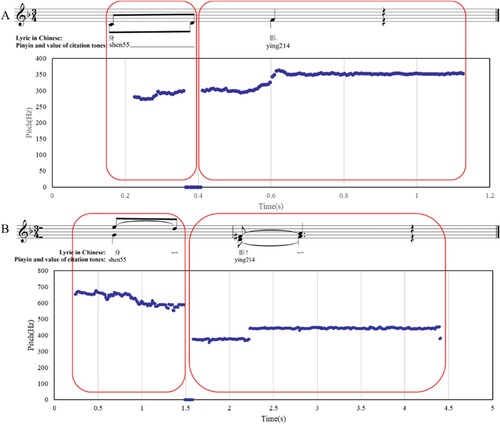
Figure 14. Song#14: A selection of the five tones in Mandarin.
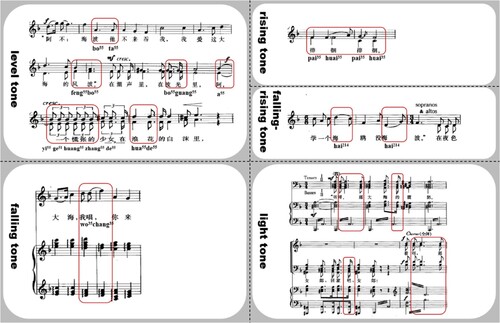
Table 6. Melodic characteristics of tone and melody in Song #14.
Figure 15. Song #14: Score excerpt and intensity curve at huayin.
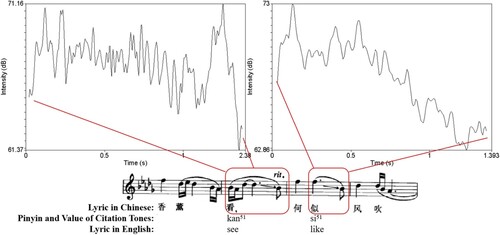
Figure 16. Score excerpt from Song #6 at the appoggiatura (left) and Song #9 with huayin and appoggiatura (right).