1,957
Views
15
CrossRef citations to date
0
Altmetric
Articles

4D measurements of biological and synthetic structures using a dynamic interferometer

Pages S20-S29 | Received 02 Aug 2016, Accepted 20 Feb 2017, Published online: 23 Mar 2017

Figures & data

Figure 1. Polarization phase-shifting triple-interferometer. Li: Lens. MO: Microscope objective. BS: Beam splitter. PBS: Polarizing Beam splitter. Pi: Lineal polarizer filters. Mi: Mirrors. Beam cross section a = 2 mm. x0 = 2.5 mm. L1 = 100 mm (Video 1).
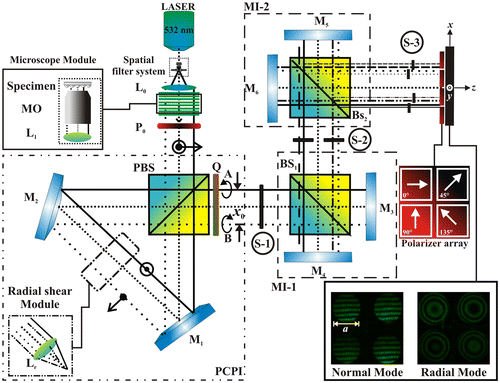
Figure 1. Polarization phase-shifting triple-interferometer. Li: Lens. MO: Microscope objective. BS: Beam splitter. PBS: Polarizing Beam splitter. Pi: Lineal polarizer filters. Mi: Mirrors. Beam cross section a = 2 mm. x0 = 2.5 mm. L1 = 100 mm (Video 1).

Figure 2. Temporal variation of the system showing the (a) four-phase shifted interferograms obtained in a single shot, its corresponding (b) wrapped and (c) unwrapped phase. By taking 1000 frames we obtain the (d) average and (e) standard deviation of each pixel of the demodulated phase.
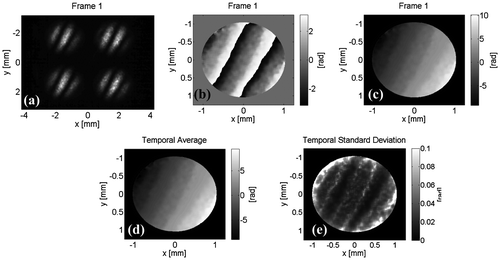
Figure 2. Temporal variation of the system showing the (a) four-phase shifted interferograms obtained in a single shot, its corresponding (b) wrapped and (c) unwrapped phase. By taking 1000 frames we obtain the (d) average and (e) standard deviation of each pixel of the demodulated phase.

Figure 3. Temporal variation of the unwrapped phase selecting the central pixel of  Figure 2.

Figure 3. Temporal variation of the unwrapped phase selecting the central pixel of  Figure 2.

Figure 4. Pseudoscorpion (a) π/2- shifted interferograms captured in a single shot. (b)–(c) OPD.

Figure 4. Pseudoscorpion (a) π/2- shifted interferograms captured in a single shot. (b)–(c) OPD.

Figure 5. Human red blood cells (a) π/2-shifted interferograms captured in a single shot. (b) OPD of sample of RBC. (c) OPD of single RBC. (d) Transversal section of  RBC.
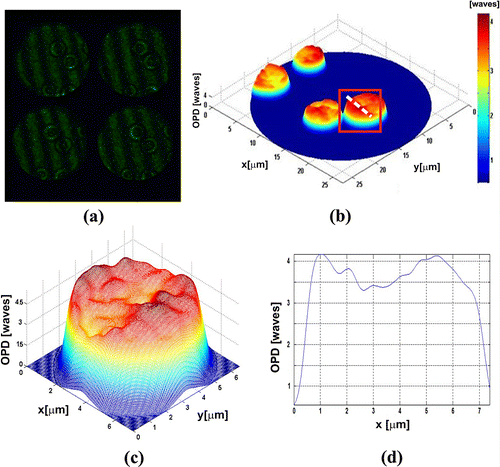
Figure 5. Human red blood cells (a) π/2-shifted interferograms captured in a single shot. (b) OPD of sample of RBC. (c) OPD of single RBC. (d) Transversal section of  RBC.

Figure 6. Dynamic sample (Video 2). Temporal evolution of the OPD of RBC. 5 frames per second.

Figure 6. Dynamic sample (Video 2). Temporal evolution of the OPD of RBC. 5 frames per second.

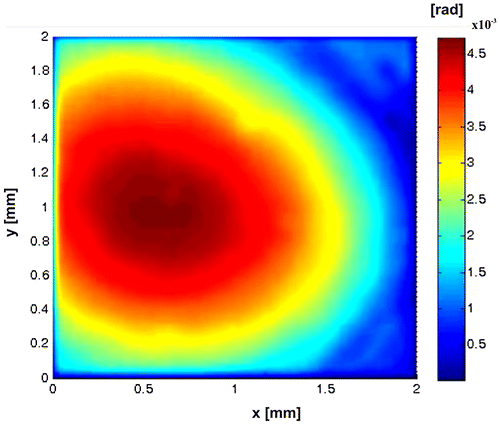
Figure 7. Four plastic microparticles (a) Four π/2-shifted interferograms captured in a single shot. (b)–(c) Slope.
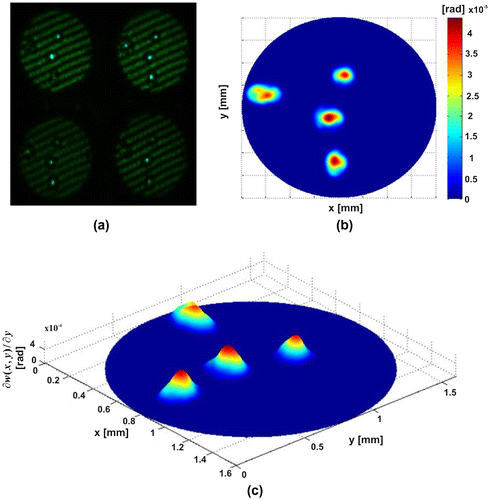
Figure 7. Four plastic microparticles (a) Four π/2-shifted interferograms captured in a single shot. (b)–(c) Slope.
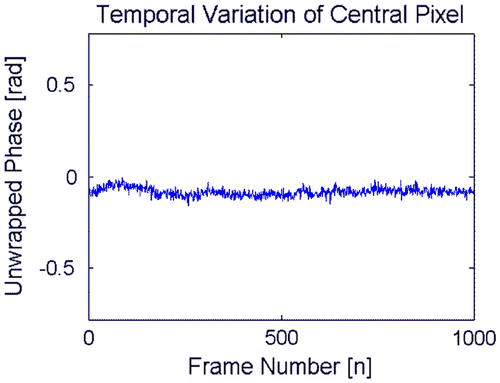
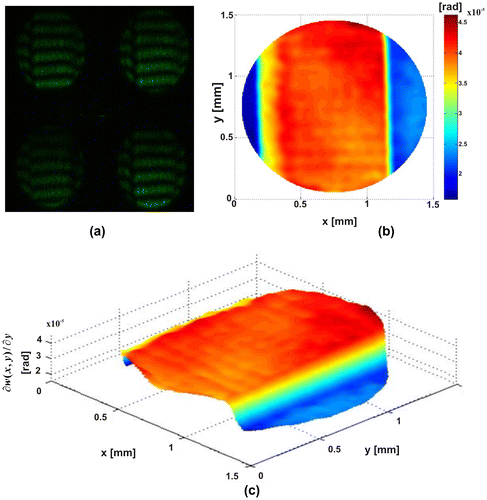
Figure 8. Thin film. (a) Four π/2-shifted interferograms captured in a single shot. (b)–(c) Slope.
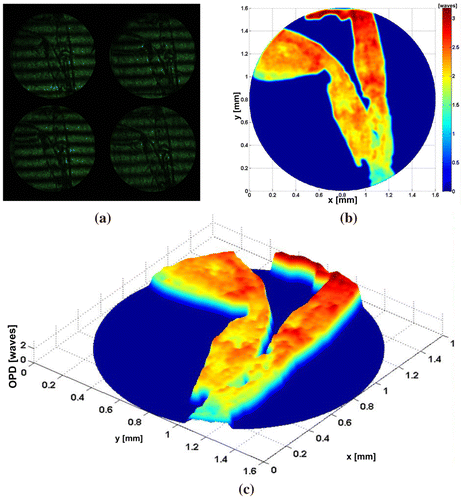
Figure 8. Thin film. (a) Four π/2-shifted interferograms captured in a single shot. (b)–(c) Slope.
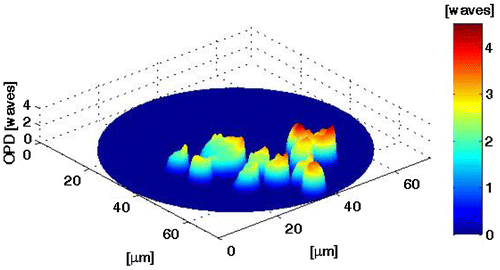
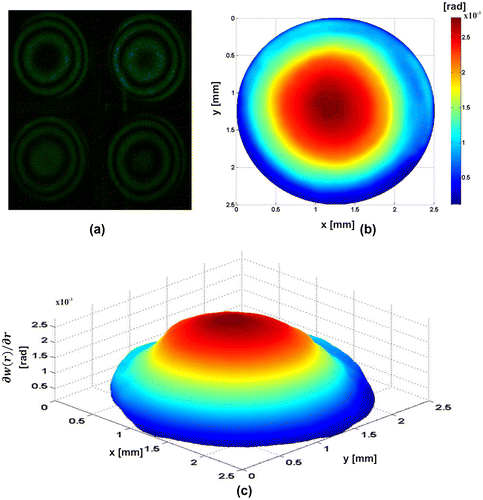
Figure 9. Radial Mode. Spherical wavefront. (a) Four π/2-shifted interferograms captured in a single shot. (b)–(c) Radial slope.

Figure 9. Radial Mode. Spherical wavefront. (a) Four π/2-shifted interferograms captured in a single shot. (b)–(c) Radial slope.

Figure 10. Dynamic samples (Video 3). Temporal evolution of the radial slope. 2 frames per second.

Figure 10. Dynamic samples (Video 3). Temporal evolution of the radial slope. 2 frames per second.
Supplemental material

Supplementary_material.zip

Download Zip (2.9 MB)