Figures & data
Figure 1. Setup of the visual experiment.
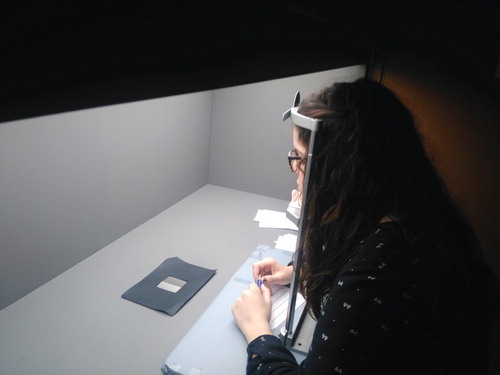
Figure 2. The set of samples (Effect Navigator chart) used in the visual experiment. From top to bottom: L1 (lighter) to L5 (darker). From left to right: increasing flake size.
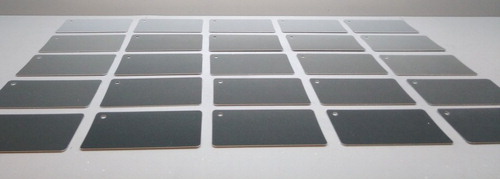
Figure 3. The graininess value measured by the BYK-mac-i instrument for the set of samples used in this experiment.
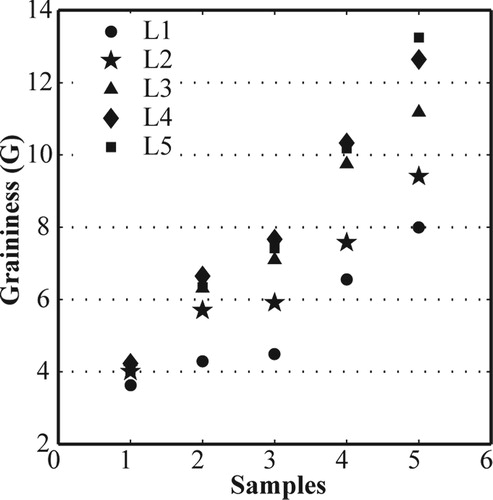
Figure 4. Box plot for each pair for two lightness profiles. Left: light samples (L1); right: dark samples (L5).
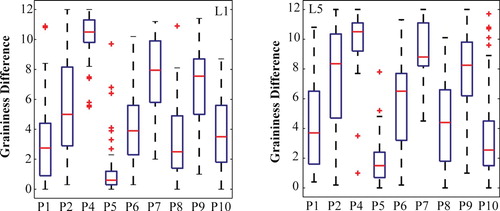
Figure 5. Data dispersion in statistical dimensions for the graininess attribute evaluated by a visual experiment.
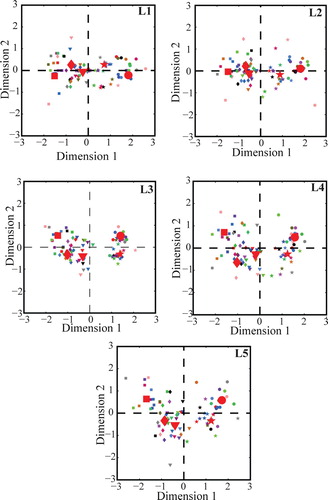
Figure 6. Comparison between the visual differences (dissimilarities) and disparities calculated with the MDS analysis. Left: light samples (L* = 60); right: dark samples (L* = 15).
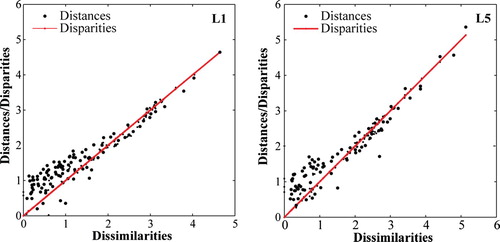
Figure 7. MDS-Dimension vs. Stress according to the lightness value.
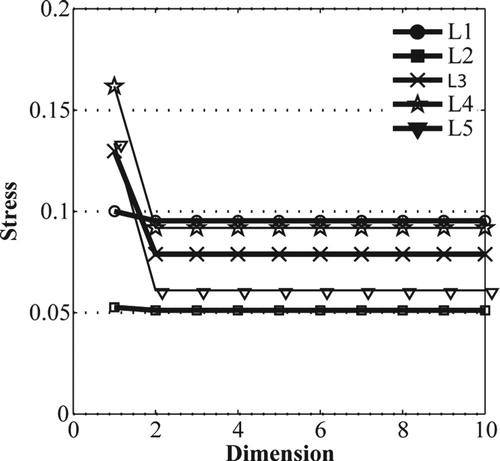
Figure 8. Relationship between the statistical dimensions and the graininess parameter calculated by the BYK-mac-i multi-angle spectrophotometer. (a) Dimension 1 vs. GBYK-mac. (b) Dimension 2 vs. GBYK-mac.
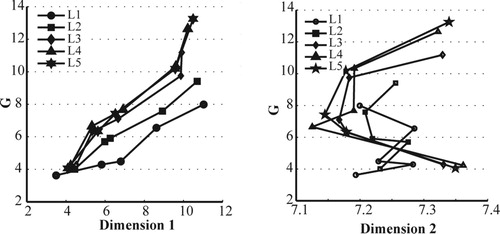
Figure 9. Relationship between statistical dimension 2 and lightness value L* for the 45°as45° measurement geometry.
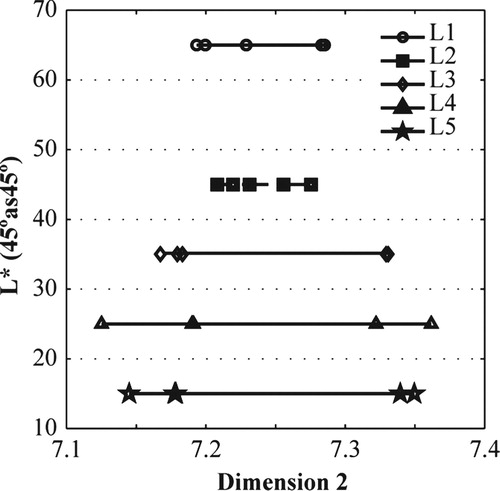
Figure 10. Relationship between statistical lightness value L* for the 45° as 45° measurement geometry and the slope computed for G vs. Dim. 1.
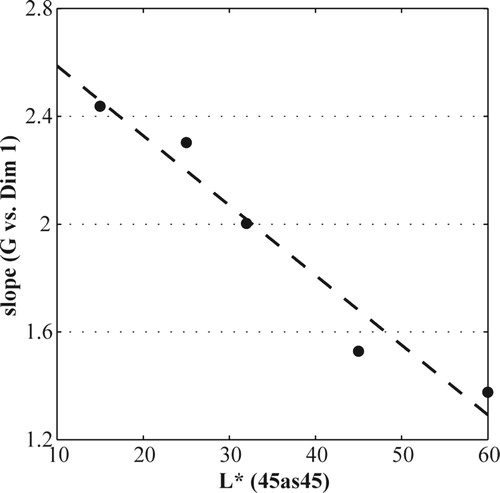
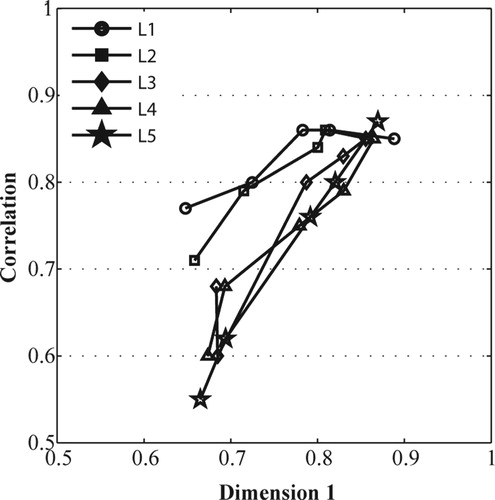
Figure 11. The relationship between the first dimension and the correlation parameter calculated by the gonio-hyperspectral system.