Figures & data
Figure 1. Principal of analyzing method. (a) Before lateral shift. (b) After lateral shift.
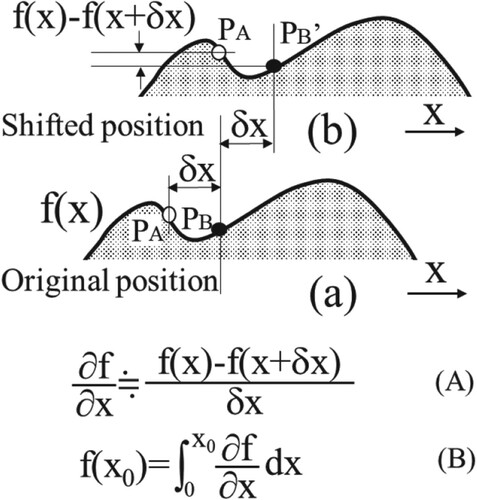
Figure 2. Detection of two dimensional phase distribution using perfect optical system.
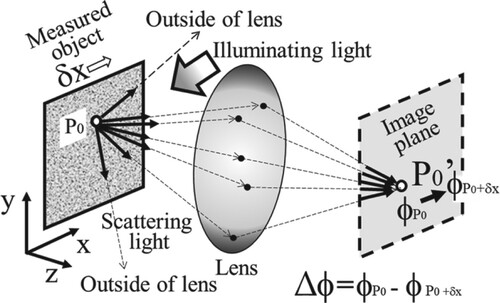
Figure 3. Optical system.
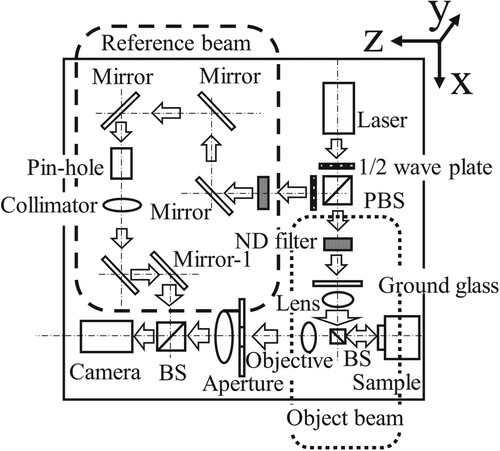
Figure 4. Flow chart of processing.
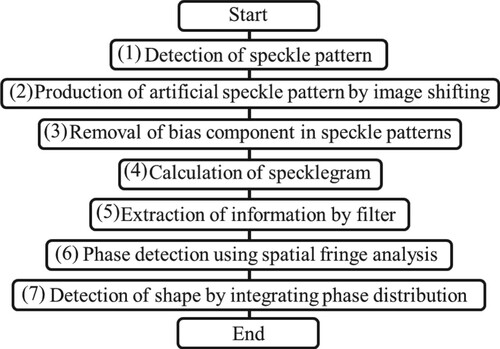
Figure 5. Image processing. (a) SEM image. (b) Speckle pattern. (c) Artificial speckle pattern as second speckle pattern. (d) Speckle pattern in frequency domain. (e) Specklegram. (f) Specklegram in frequency domain. (g) Filtered specklegram.
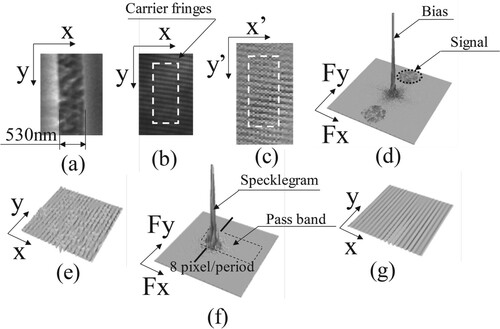
Figure 6. Measured result. (a) Differential distribution of phase. (b) Three dimensional shape.
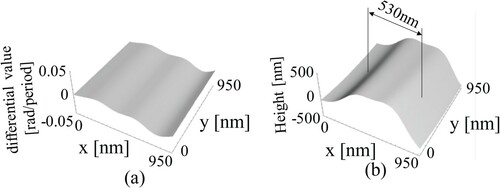
Figure 7. Measured results. (a) SEM image. (b) Speckle pattern. (c) Three dimensional shape.
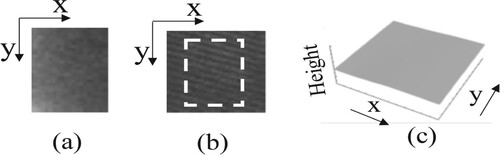
Figure 8. Measured results (Brightness). (a) Brightness distribution in A-A’ cross section. (b),(c),(d),(e) Specklepatterns under each brightness shown in (a) (f),(g),(h),(i) Three dimensional shape under each brightness shown in (a).
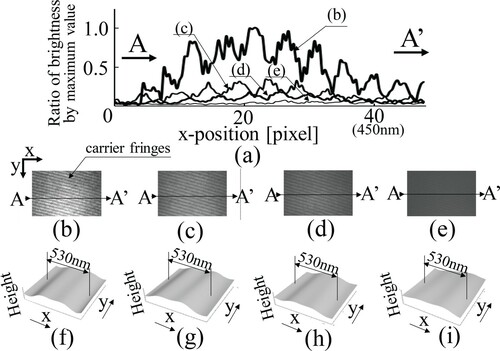
Figure 9. Measured result (focus). (a) Below focus (−1µm). (b) Just focus. (c) Over focus (1µm).
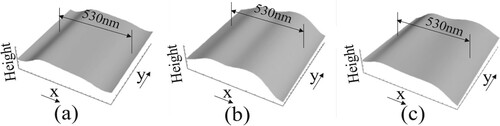
Figure 10. Measured result (frequency range of optical system). (a)Three dimensional shape (f = 8). (b) Three dimensional shape (f = 11). (c) Three dimensional shape (f = 16). (d) Speckle pattern in frequency domain (f = 8). (e) Speckle pattern in frequency domain (f = 11). (f) Speckle pattern in frequency domain (f = 16). (g) Shape in B-B’ cross section.
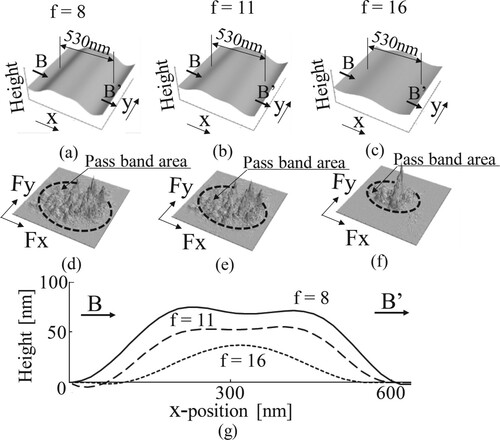
Figure 11. Measured result (Passband of filter). (a) 8–7 pixel/period (from O to A). (b) 8-5.5 pixel/period (from O to B). (c) 8-4.5 pixel/period (from O to C). (d) 8-3.7 pixel/period (from O to D). (e) 8-3.1 pixel/period (from O to E).
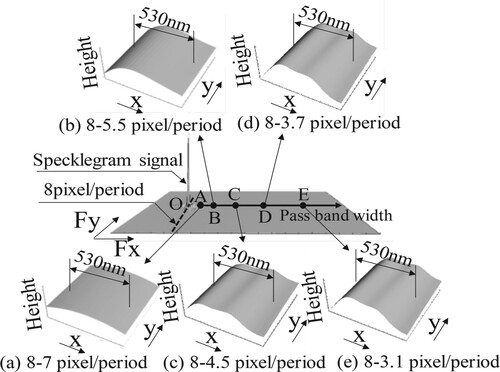
Figure 12. Measured result (Length of one pixel on each image). (a) Specklepattern (8.8 nm/pixel), (c) Specklepattern (11.5 nm/pixel), (e) Specklepattern (14.7 nm/pixel), (g) Specklepattern (17.8 nm/pixel), (i) Specklepattern (21.6 nm/pixel), (k) Specklepattern (27.3 nm/pixel). (b) Three dimensional shape (8.8 nm/pixel), (d) Three dimensional shape (11.5 nm/pixel), (f) Three dimensional shape (14.7 nm/pixel), (h) Three dimensional shape (17.8 nm/pixel), (j) Three dimensional shape (21.6 nm/pixel), (l) Three dimensional shape (27.3 nm/pixel).
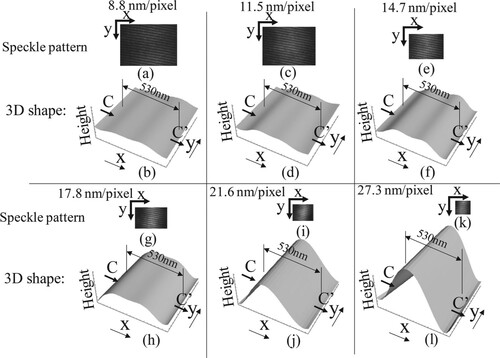
Figure 13. Measured result (Length of one pixel on each image) on C-C’ cross section in Figure .
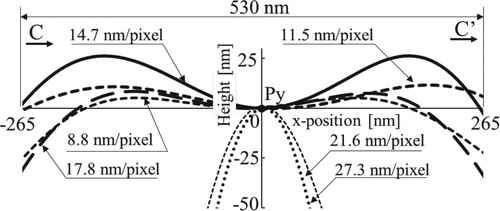
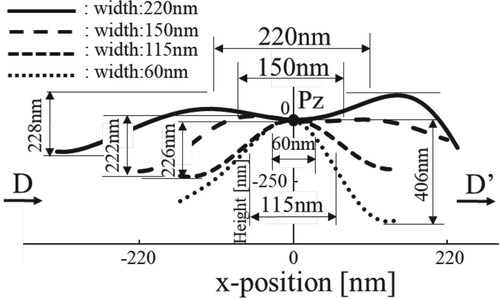
Figure 14. Measured result (Line width). (a) SEM image (220 nm), (d) SEM image (150 nm), (g) SEM image (115 nm), (j) SEM image (60 nm). (b) Speckle pattern (220 nm), (e) Speckle pattern(150 nm), (h) Speckle pattern (115 nm), (k) Speckle pattern (60 nm), (c) Three dimensional shape (220 nm), (f) Three dimensional shape (150 nm), (i) Three dimensional shape (115 nm), (l) Three dimensional shape (60 nm).
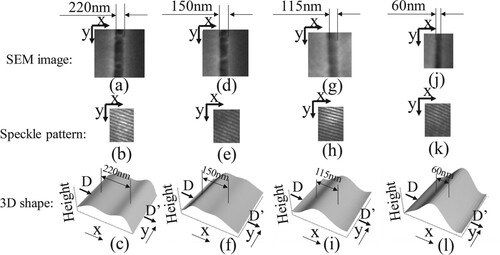
Figure 15. Measured results (Line width) on D-D’ cross section in Figure .