Figures & data
Figure 1. The PACKS model (Millar et al., Citation1994) relates the various phases in inquiry and the types of knowledge affecting the decisions made in these phases.
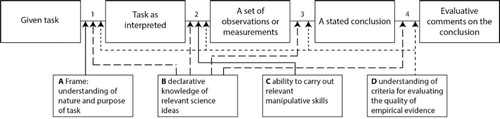
Table 1. Data analysis and interpretation skills for 15-year-olds in selected international curricula assessed in interview (I1–3) and practical (P1–3) probes.
Figure 2. Graphs presented to interviewees in probes I1–3, respectively.
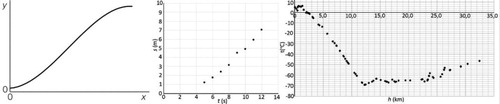
Figure 3. Practical probes P1–3 on analysis of data and drawing conclusions
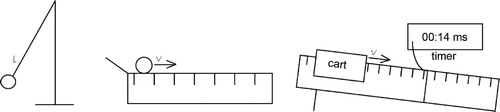
Table 2. Level attainment criteria (where level ‘Novice’ is allocated if neither ‘Master’ nor ‘Intermediate’ apply).
Figure 4. Attainment levels per student pair in each competence (N = 51).
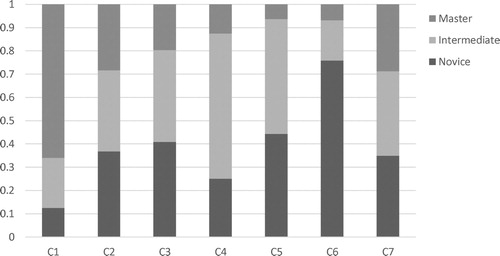
Figure 5. A representative graph from P2 (P2–3) with travelled distance displayed on the x-axis and the measured time on the y-axis. Scientific conventions (C1) are satisfied, the trend line is smooth, partly connecting the data points (C2).
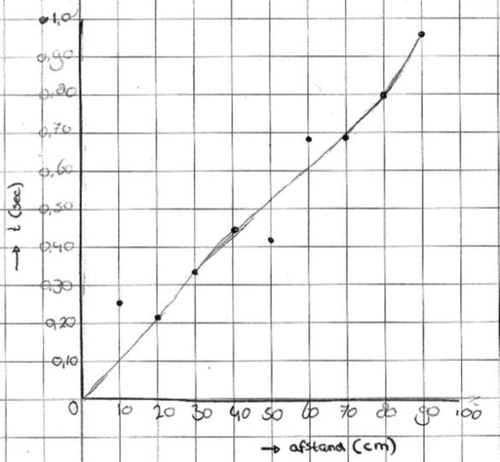
Figure 6. A straight line is drawn in I2, disregarding the identified anomaly at t = 9 s. As the graph displays the motion of a ball, starting from rest, in a travelled distance versus time graph, the origin should be used as well.
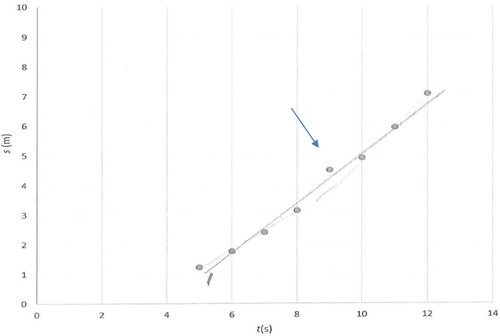
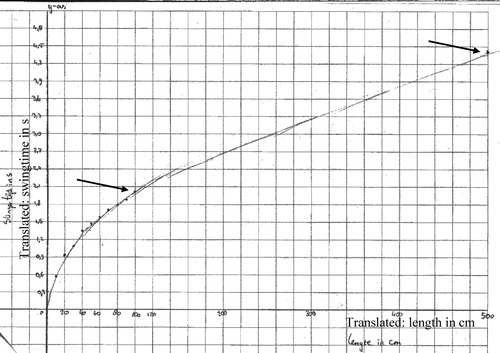
Figure 7. In probe P1, students investigate how the swing time (y-axis) is affected by the length of the swing (x-axis). Some students combine a curved and a straight line to connect the last datum of initial dataset with the additional datum at l = 5,0 m, both indicated with arrows.