
Figures & data
Table 1. Questions and hypotheses of this study.
Table 2. Popularity of the species according to the identification rate.
Table 3. Factors influencing the average species knowledge M with standard error (SE), the ANOVA-Values (F), significance (p) according to a univariate GLM sorted by the effect size partial η².
Figure 1. Average species knowledge M of pupils in different schools with error bars showing the standard error (SE).
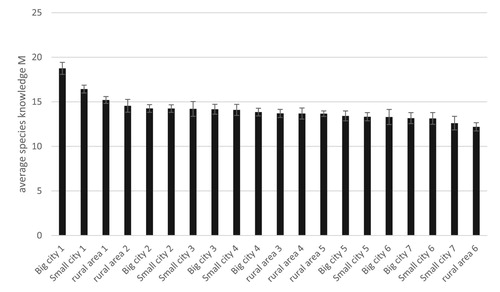
Figure 2. Summary of factors influencing species knowledge with their effect sizes. Non-significant factors are marked with dotted lines and smaller font size.
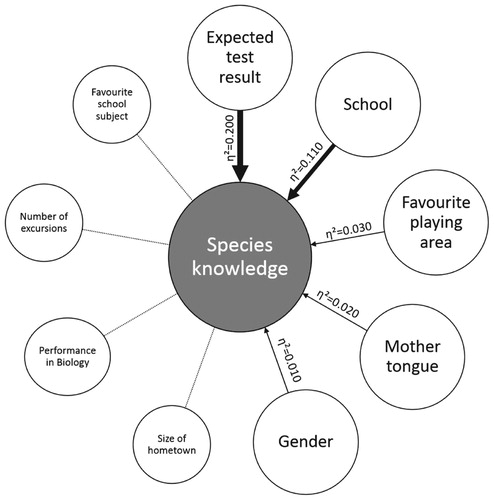
Figure 3. Proportions of correct identifications on species level tested in 2018. Species that were not tested in 2006 are marked with an ‘*’.
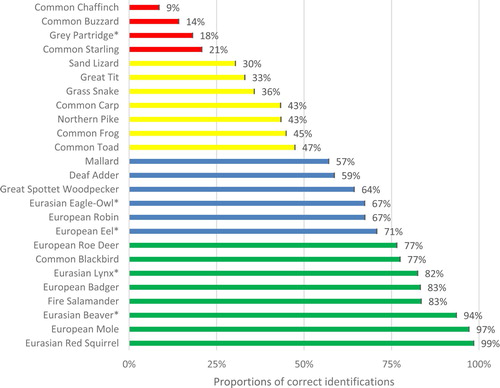
Figure 4. Proportions of correct identifications for the different vertebrate classes with error bars showing the standard error depending on the pupils’ interest in the vertebrate class.
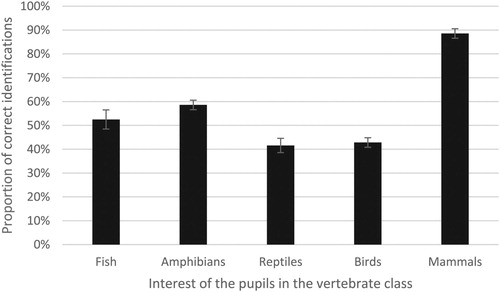
Table 4. Species showing a difference of 5% or greater between the identification rates on species level and on a higher taxonomic level in 2018 and 2006.
Figure 5. Average species knowledge (M) of boys and girls in 2006 and 2018 with error bars showing the standard error (SE).
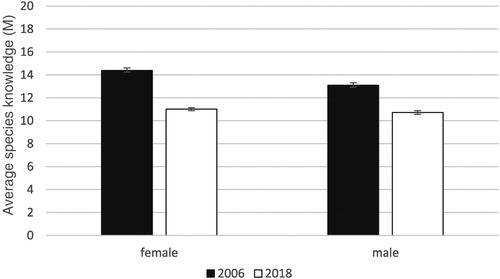
Figure 6. Differences in identification rates of vertebrate classes with the same species tested in 2018 and in 2006 with significant differences indicated by ‘*’.
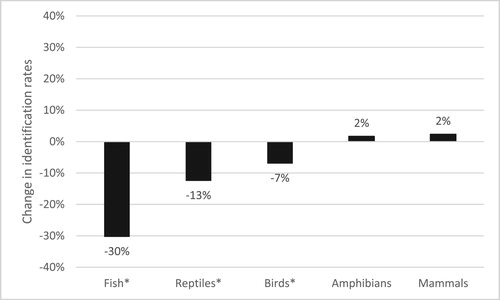
Figure 7. Changes in identification rates of the different vertebrate species tested in 2018 compared to those in 2006 with significant changes indicated by ‘*’.
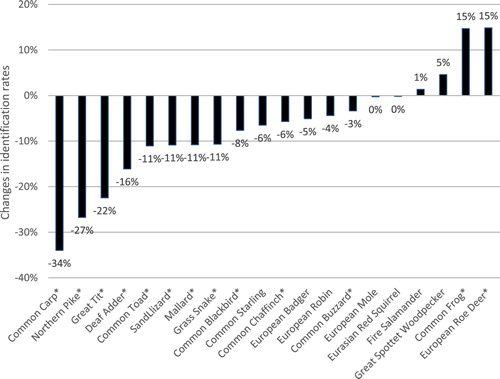
Table 5. Ranking of species’ identification rates in 2006 compared to those in 2018.
Data availability statement
Raw data were generated at the Ludwig-Maximilians University Munich. Derived data supporting the findings of this study are available on request.