Figures & data
Table 1. A summary of the CoC lesson sequence implemented and the data collected.
Table 2: Summary of actants identified by each group during the two mapping activities (lighter-shaded cells indicate actants in Map 2 also present in Map 1; darker-shaded cells indicate actants in Map 2 not present in Map 1; actants in bold indicate 4 or more connections to other actants)
Figure 1. Areas of uncertainty for Group A students based on the questions asked during the first mapping task.
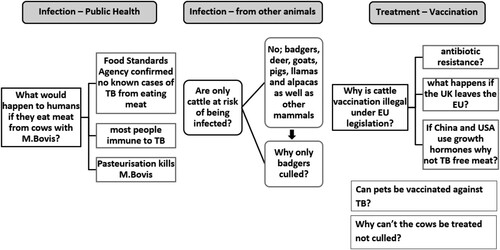
Table 3: The themes identified in Group A’s exploration of the badger-cattle controversy
Table 4. Transcript extract presenting Group A students’ representation of complexity during the construction of Map 1.
Figure 2. Areas of uncertainty for Group B students based on the questions asked during the first mapping task.
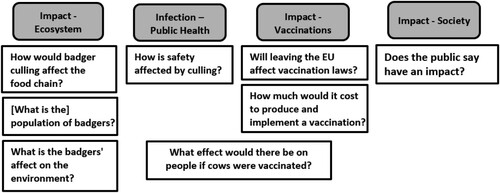
Table 5: The themes identified in Group B’s exploration of the badger-cattle controversy
Table 6. Group B’s discussion of the value of cattle over the value of badgers during Lesson 1.
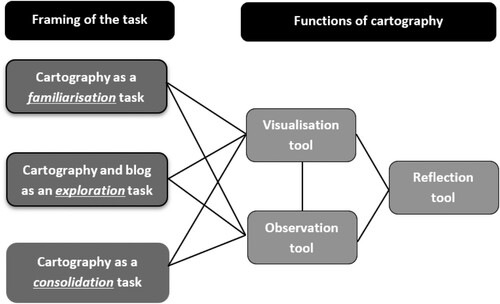
Figure 3. The framing and functions of cartography construction identified within our pedagogical approach.