Figures & data
Table 1. Grade and age distribution of participants.
Table 2. Distribution of traditional (upper scale) DAST-C indicators by class level.
Table 3. Distribution of alternative (lower scale) DAST-C indicators by class level.
Table 4. Analysis of drawings using the mDAST criteria (Farland-Smith, Citation2012).
Table 5. Distribution of traditional (upper scale), alternative (lower scale) and total DAST-C indicators by class level and gender.
Figure 1. Proportion of male and female scientists drawn across the age groups.
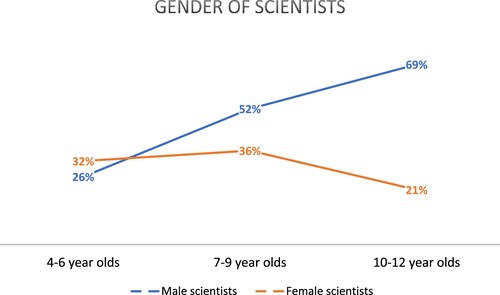
Figure 2. Proportion of male and female scientists drawn by boys and girls.
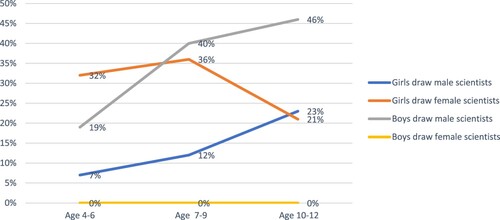
Table 6. Analysis of the drawings by boys and girls using the mDAST criteria.
Table 7. Comparison groups by study timing (before and during COVID19).
Table 8. Distribution of DAST-C indicators prior to and post-COVID.
Table 9. Analysis of drawings using the mDAST criteria (before and during COVID19) on children from Senior Infants (age 4–6) and Fourth class (age 9–10).
Figure 3. Drawing of a scientist made by a 6-year-old child (senior Infants) during the pandemic (with handwritten transciption made by the teacher of the child’s description).
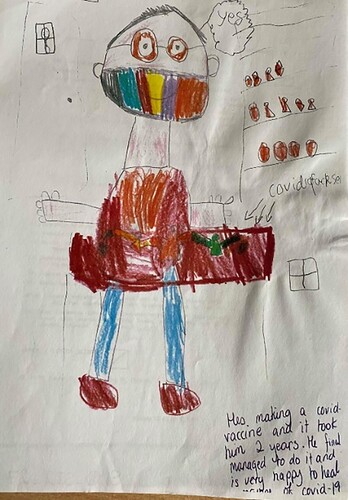
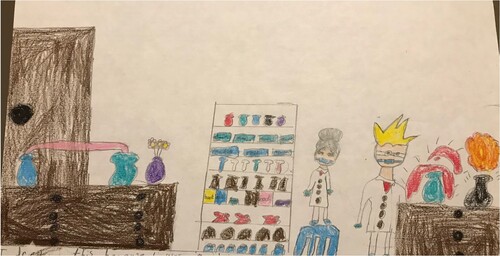
Figure 4. Drawing of a scientist made by a ten-year-old (4th class) child during the pandemic.