Figures & data
Table 1. Study structure.
Figure 1. Affective characteristics of the focus students at the start of the study.
Note: The values result from a Rasch analysis done on the data of all the students who answered the survey. The colours are a gradient of positive blue and negative red. As an affective characteristic becomes more positive, its hue becomes bluer, or redder as the characteristic becomes more negative. White cells are in the middle range of the results. Cells marked with X represent values of a characteristic that couldn’t be Rasch-calculated for a particular child.
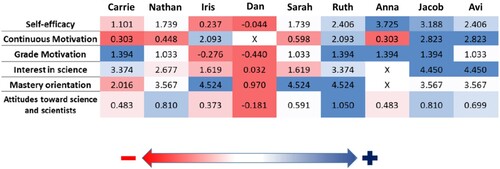
Table 2. Summary of trends in each of the stories.
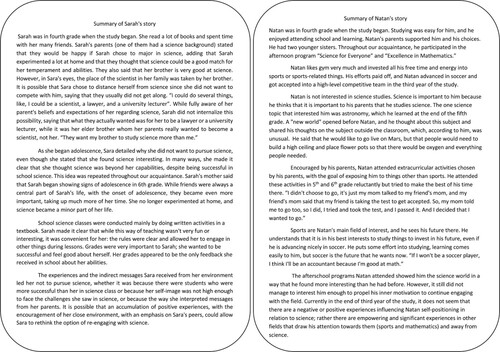
Figure 2. Two story summaries.