977
Views
3
CrossRef citations to date
0
Altmetric
Articles

Effect of geometrical constraint condition on the formation of nanoscale twins in the Ni-based metallic glass composite

, , , , &
Pages 351-360 | Received 08 Nov 2013, Accepted 16 Mar 2014, Published online: 14 Apr 2014

Figures & data

Figure 1. (colour online) (a) Optical microscope image taken from the longitudinal cross-section of the as-extruded brass reinforced Ni-based MG composite before the compression test; (b) Optical microscope image taken from the longitudinal cross-section of the brass reinforced Ni-based MG composite after the compression test. (marked circles show non-effective reinforcements); (c) Equivalent von Mises stress (i.e. shear stress) and (d) hydrostatic pressure predicted from FEA modelling of the composite structure corresponding to the micrograph in (a). The FEA shows effective local concentrations of shear stress and pressure under macroscopic uniaxial compression in regions where the second-phase particles are in close proximity to each other. The FEA model is deformed with 3.3% compression in the vertical direction.
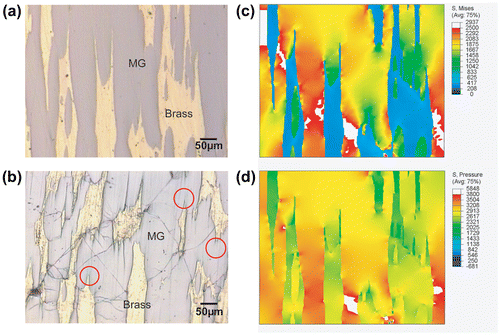
Figure 1. (colour online) (a) Optical microscope image taken from the longitudinal cross-section of the as-extruded brass reinforced Ni-based MG composite before the compression test; (b) Optical microscope image taken from the longitudinal cross-section of the brass reinforced Ni-based MG composite after the compression test. (marked circles show non-effective reinforcements); (c) Equivalent von Mises stress (i.e. shear stress) and (d) hydrostatic pressure predicted from FEA modelling of the composite structure corresponding to the micrograph in (a). The FEA shows effective local concentrations of shear stress and pressure under macroscopic uniaxial compression in regions where the second-phase particles are in close proximity to each other. The FEA model is deformed with 3.3% compression in the vertical direction.

Table 1. Materials constants for the constitutive laws used in FEA modelling.

Figure 2. (colour online) Microstructural characterization related with phase transformation: (a) BF TEM image obtained from the as-extruded brass reinforced the Ni-based MG composite before deformation; (b) SADP obtained from the brass reinforcement (marked by the red arrow) of Ni-based MG composite before deformation showing a typical FCC crystallographic structure; (c) BF TEM image obtained from the brass reinforced Ni-based MG composite after deformation revealing nanoscale twins and adjacent nanocrystals; (d) SADP obtained from the brass reinforcement (marked by the red arrow) of the Ni-based MG composite after deformation showing a typical twinned structure.
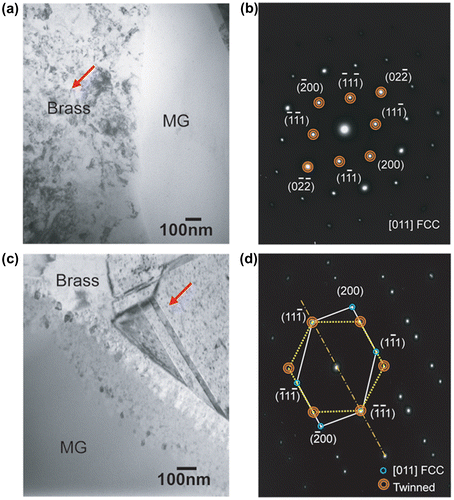
Figure 2. (colour online) Microstructural characterization related with phase transformation: (a) BF TEM image obtained from the as-extruded brass reinforced the Ni-based MG composite before deformation; (b) SADP obtained from the brass reinforcement (marked by the red arrow) of Ni-based MG composite before deformation showing a typical FCC crystallographic structure; (c) BF TEM image obtained from the brass reinforced Ni-based MG composite after deformation revealing nanoscale twins and adjacent nanocrystals; (d) SADP obtained from the brass reinforcement (marked by the red arrow) of the Ni-based MG composite after deformation showing a typical twinned structure.

Figure 3. (colour online) (a) Schematic representation of the nominal locations where the TEM samples were obtained from the brass reinforced Ni-based MG composite; (c) BF TEM image obtained from the Ni-based monolithic BMG after deformation showing nanocrystallines (marked by the yellow arrows) generated around shear bands near the corner of the specimen (region B in Figure a).
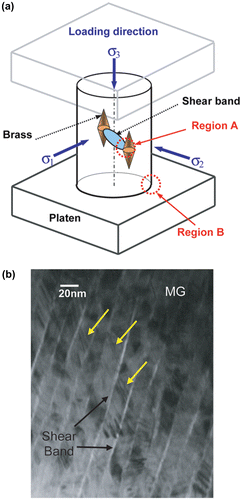
Figure 3. (colour online) (a) Schematic representation of the nominal locations where the TEM samples were obtained from the brass reinforced Ni-based MG composite; (c) BF TEM image obtained from the Ni-based monolithic BMG after deformation showing nanocrystallines (marked by the yellow arrows) generated around shear bands near the corner of the specimen (region B in Figure 3a).