
Figures & data
Table 1. Analysed geometries.
Table 2. Geometry A – settings of training parameters.
Figure 1. Geometry A – Displacement (top left), strength coefficient (top right), and volume (centre bottom) evaluation during optimisation (F1, F2, F3).
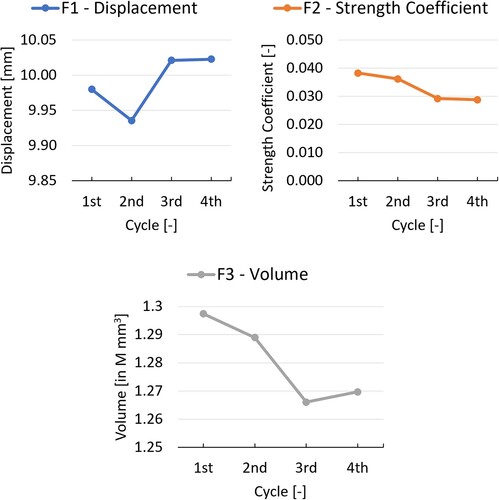
Figure 2. Geometry A – The thicknesses change during the optimisation process.
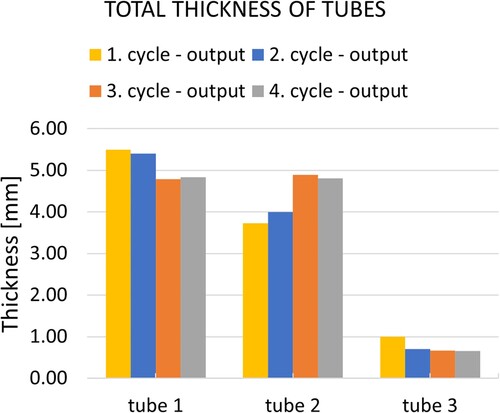
Figure 3. Geometry A – Final optimised geometry (left) and Geometry B – representation of the original geometry (right).
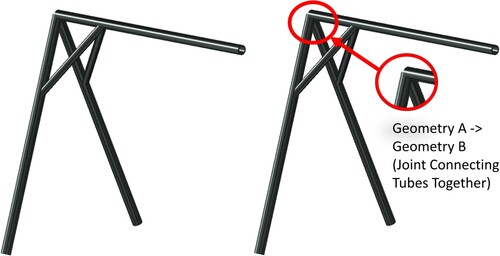
Table 3. Geometry A – Optimised structure parameters.
Figure 4. Geometry B – Displacement (top left), strength coefficient (top right), and volume (centre bottom) evaluation during optimisation (F1, F2, F3).
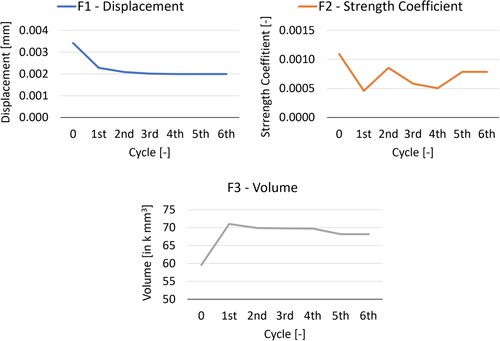
Figure 5. Geometry B –Thicknesses change during the optimisation process.
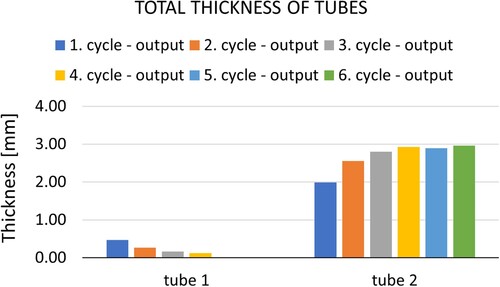
Table 4. Geometry B – Optimised structure parameters.
Figure 6. Geometry C – Displacement (top left), strength coefficient (top right), and volume (centre bottom) evaluation during optimisation (F1, F2, F3).
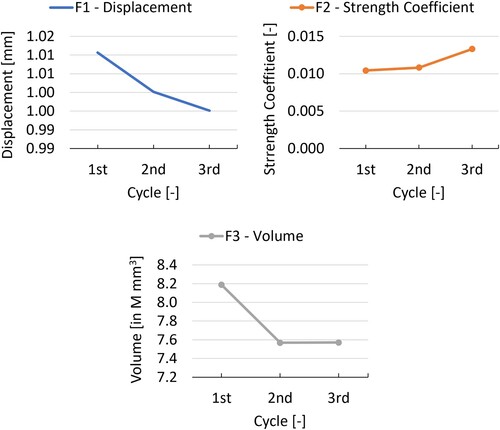
Table 5. Geometry C – Optimised structure parameters.