
Figures & data
Figure 1. The unstable equilibrium configuration of 558 line defect in graphene, which can be regarded as a carbon atomic chain with period a subjected in the middle of two graphene half-lattices.
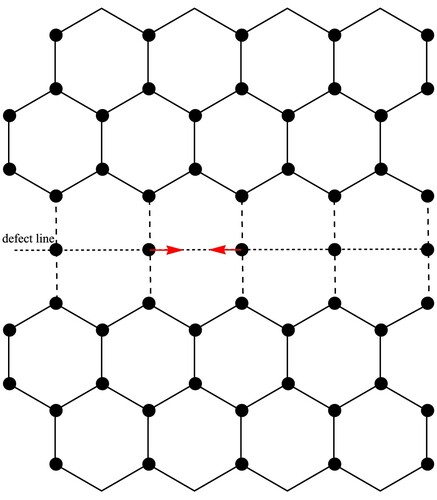
Figure 2. The substrate potential generated by the two graphene half-lattices, which is a function of displacement. The red dots are calculated results by first-principles simulation and the solid line is the fitting curve by Equation (Equation3(3)
(3) ).
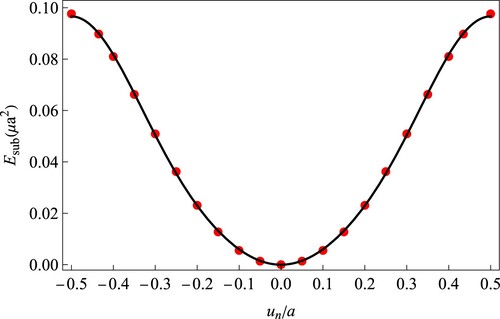
Figure 3. Atomic arrangements of a 558 line defect in graphene result from the generalised FK model (dots) and the first-principles simulation (circles).
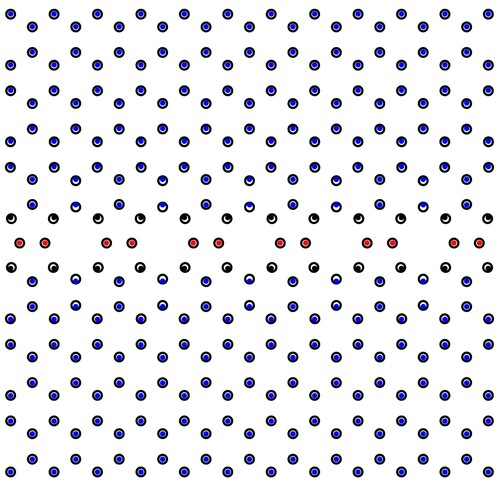
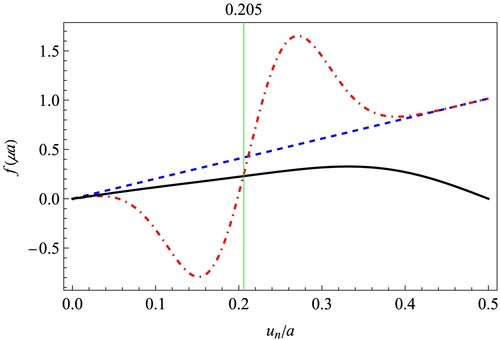
Figure 4. Comparison between the two sides of the force balance equation (Equation8(8)
(8) ). The black solid curve represents the substrate force generated by the two graphene half-lattices, i.e. the right-hand side of Equation (Equation8
(8)
(8) ). The other two curves represent the interatomic interaction force in the chain. The red dashed and dotted curve takes both the force terms on the left-hand side of Equation (Equation8
(8)
(8) ) into account, while the blue dashed curve only takes in the first harmonic term as the conventional FK model. It is clear that the blue and black curves only intersect at zero, but the red and black curves intersect at both zero and 0.205a.
Data Availability Statement
The data that support the findings of this study are available within the article.