Figures & data
Figure 1. Predicted bake-hardening obtained from the random forest regression model plotted against the experimentally measured values.
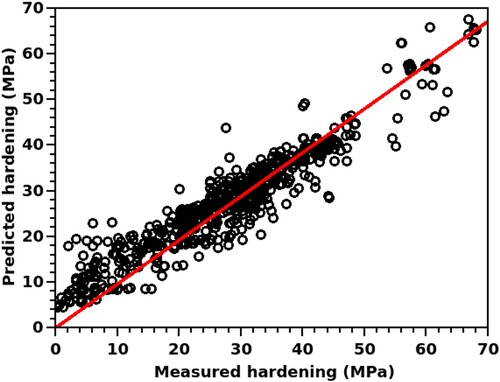
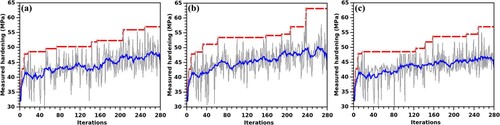
Figure 2. Evolution of the bake-hardening with the number of iterations of the Bayesian optimiser implemented with the expected-improvement acquisition functions and using the (a) squared-exponential, (b) gamma-exponential, and (c) Matérn-3/2 kernels. The fluctuating gray plots show the instantaneous values at each iteration, while the dashed red plots indicate the best value at the iteration. The blue plots obtained from the moving-window averaging exhibit the smoothed trends of instantaneous measurements.
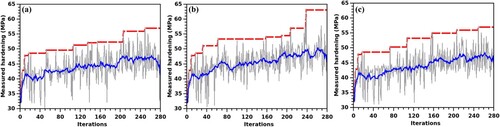
Figure 3. Bake hardening vs. iteration plots with the probability-of-improvement acquisition function. Results for the (a) squared-exponential, (b) gamma-exponential, and (c) Matérn-3/2 covariance functions are shown with the plotting scheme akin to that of .