Figures & data
Table 1. Chemical composition of the 5083 aluminum plates (wt%).
Figure 1. (a) The experimental setup, (b) a specially designed fixture, (c) a representation of different components of the force measurement fixture.
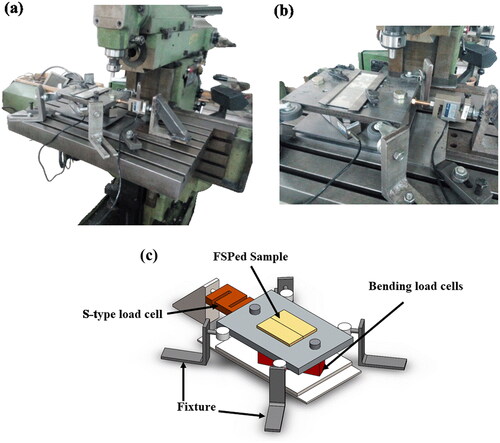
Figure 2. Schematic presentation of welding setup.
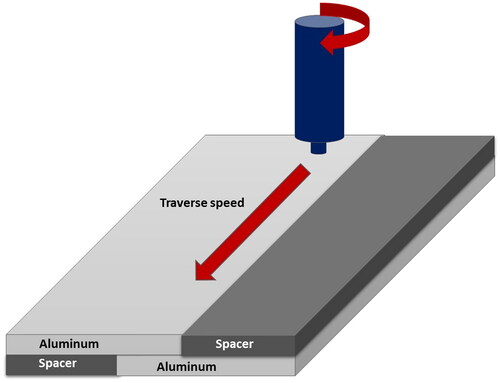
Table 2. Input parameters and their changes range in the FSW.
Figure 3. Dimensions of the prepared specimens for the tensile shear test.
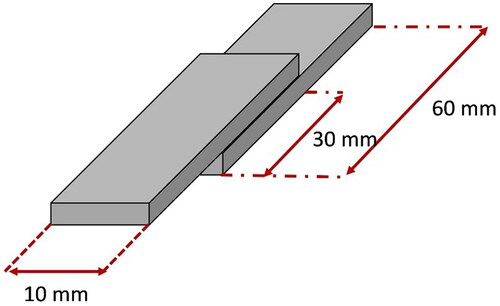
Table 3. The layout of the FSW trials.
Table 4. ANOVA of the regression model for the temperature.
Table 5. ANOVA of the regression model for the force.
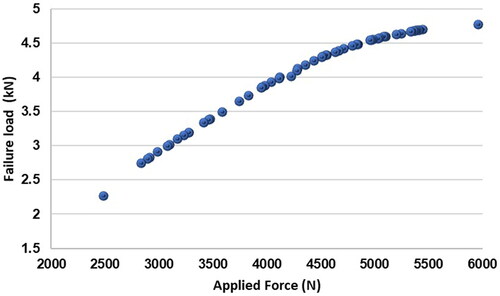
Table 6. ANOVA of the regression model for the failure load.
Figure 4. Normal probability diagram.
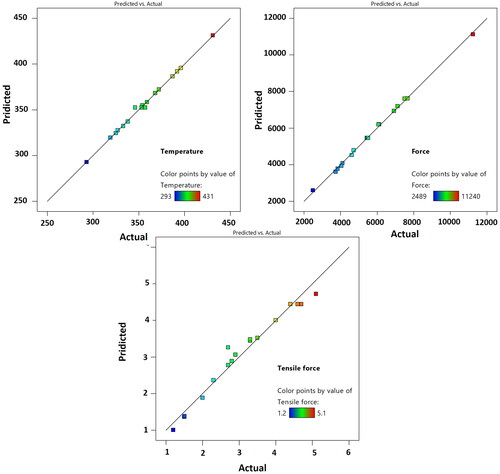
Figure 5. Response surface and contour plots of temperature against pin diameter, pin height, and shoulder diameter.
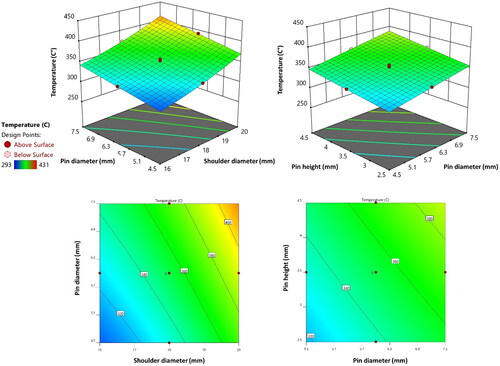
Figure 6. The perturbation plot for the response temperature.
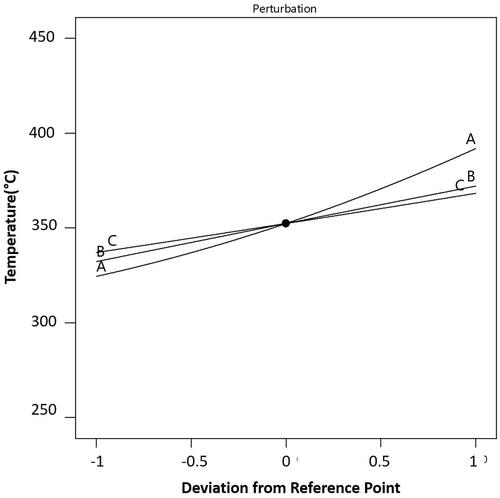
Figure 7. The axial force history.
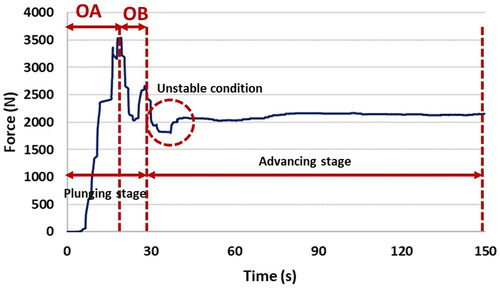
Figure 8. Response surface and contour plots of force against pin diameter, pin height, and shoulder diameter.
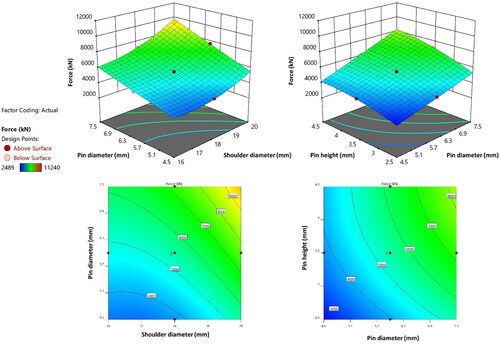
Figure 9. Response surface and contour plots of temperature against pin diameter, pin height, and shoulder diameter.
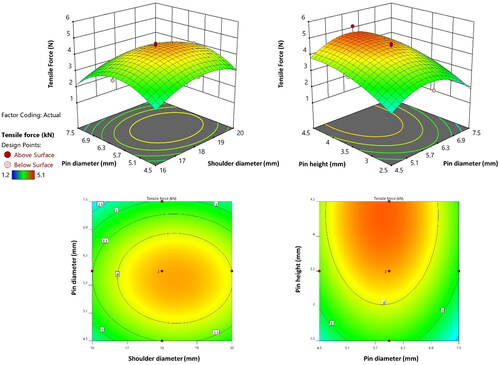
Figure 10. Macrostructure and defects of joints with different tool parameters.
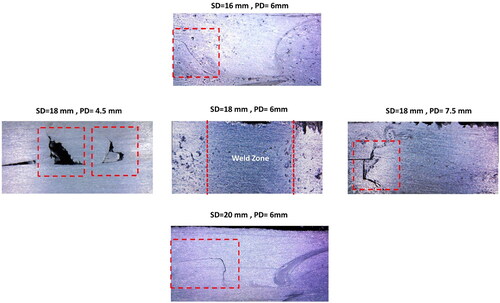
Figure 11. Optimization result (Pareto front).