Figures & data
Table 1. Sample of generated operating cost (OC) data (Al-Chalabi Citation2018)
Figure 1. Two-level system of MOGAs
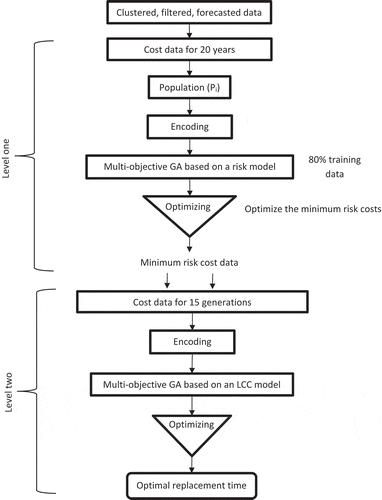
Figure 2. Normal distribution of cumulative TTF
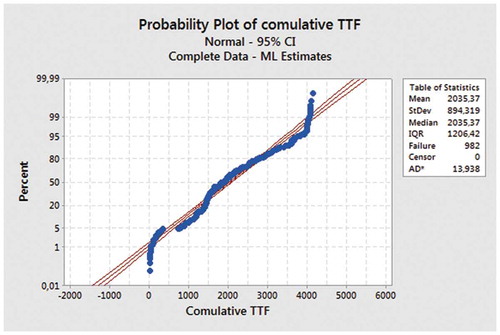
Figure 3. Risk cost estimation
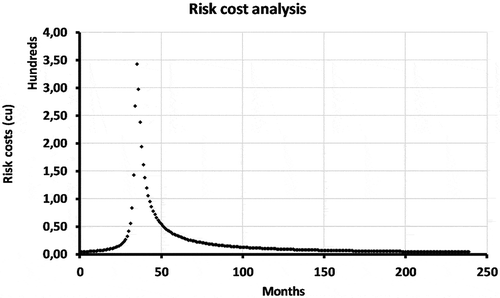
Figure 4. ORT of 121 fans as one system with a 2% risk cost
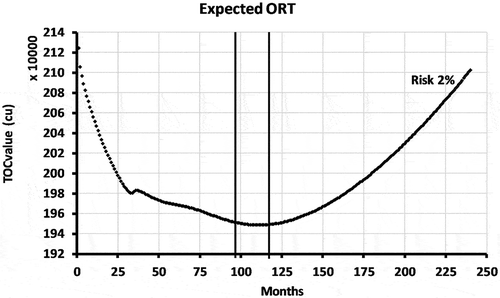
Figure 5. ORT of 121 fans as one system with a 250% risk cost
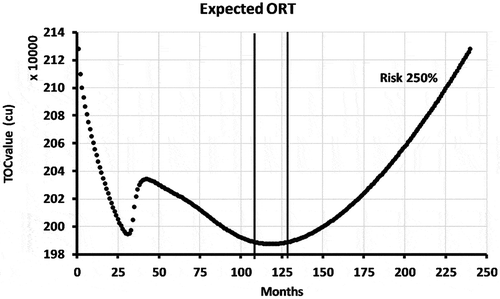
Figure 6. Risk cost analysis of 121 fans as one system
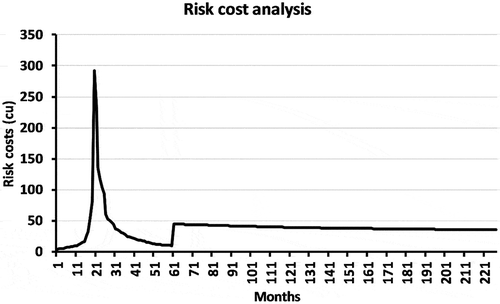
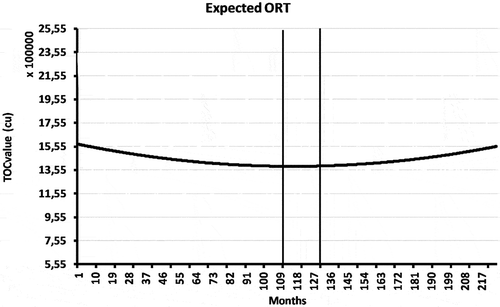
Figure 7. ORT of 121 fans as one system for the optimal result
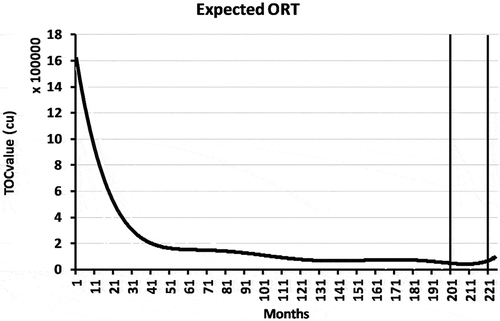
Figure 8. Example of worst ORT of 121 fans as one system