
Figures & data
Table 1. Summary of the application area and the involved requirements of 5 G-technology
Figure 1. The figure gives an overview of the methodology, including data collection and data analysis of quantitative and qualitative data.
Figure 2. The figure describes the data collection procedure. Firstly, data from the literature was used to create an evaluation matrix. Secondly, the evaluation matrix was then used during an interview setting to collect quantitative data. Qualitative data were also collected during the interview by posting open questions.
Table 2. Information about the interviewees including branch, their working title/role, and years of experience
Figure 3. An overview of the modified TOPSIS method that was used for the quantitative analysis.
Table 3. Notations used to construct the modified TOPSIS method
Figure 4. The figure describes the individual impact index of additional data sources, secured spectrum and, wide network coverage on productivity, quality, maintenance performance, flexibility, and sustainability respectively in Demo 1.
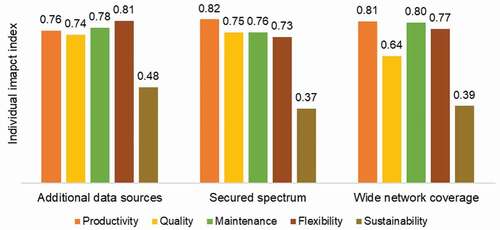
Figure 5. The figure describes the individual impact index of additional data sources, data traffic policies – prioritized devices, and centrally controlled device connectivity on productivity, quality, maintenance performance, flexibility, and sustainability respectively in Demo 2.
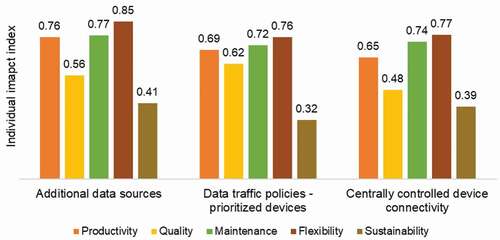
Figure 6. The figure describes the individual impact index of low latency, deterministic latency, and additional data sources on productivity, quality, maintenance performance, flexibility, and sustainability respectively in Demo 3.
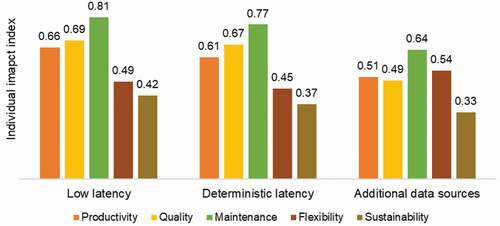
Figure 7. The figure describes the individual impact index of wide network coverage, additional data sources, and scalability on productivity, quality, maintenance performance, flexibility, and sustainability respectively in Demo 4.
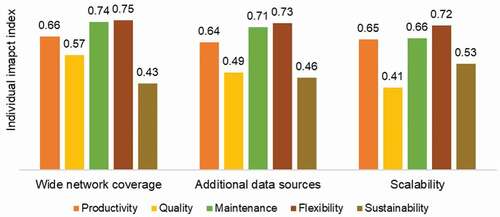
Figure 8. The figure describes the individual impact index of low latency, high bandwidth, and high data rate on productivity, quality, maintenance performance, flexibility, and sustainability respectively in Demo 5.
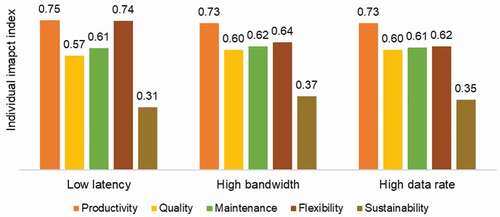
Figure 9. The figure describes the individual impact index of additional data sources, low latency, and deterministic latency on productivity, quality, maintenance performance, flexibility, and sustainability respectively in Demo 6.
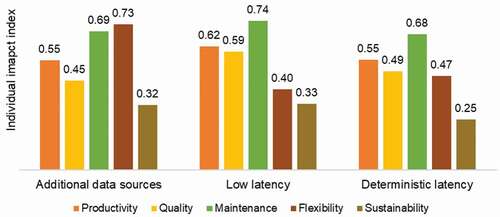
Figure 10. The figure describes the individual impact index of low latency, additional data sources, and high bandwidth on productivity, quality, maintenance performance, flexibility, and sustainability respectively in Demo 7.
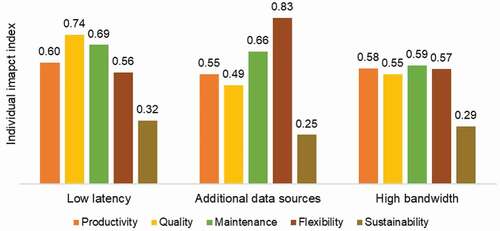
Figure 11. The figure describes the individual impact index of wide network coverage, low latency, and scalability on productivity, quality, maintenance performance, flexibility, and sustainability respectively in Demo 8.
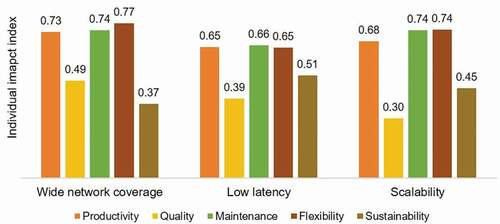
Table 4. Top three 5G-characteristics and global impact index (all demos) per PI category
Table 5. The top three 5 G-characteristics, based on all demos
Table 6. Overall impact index of 5 G on each PI category, based on all demos
Table
Table
Table
Table