Figures & data
Table 1. Classification of related energy-efficient scheduling studies.
Figure 1. Schematic diagram of the energy-efficient scheduling scheme.
Table
Figure 2. Flowchart of the proposed MA.
Figure 3. Chromosome representation.
Figure 4. Pseudocode for decoding.
Figure 5. Unbiased tournament selection.
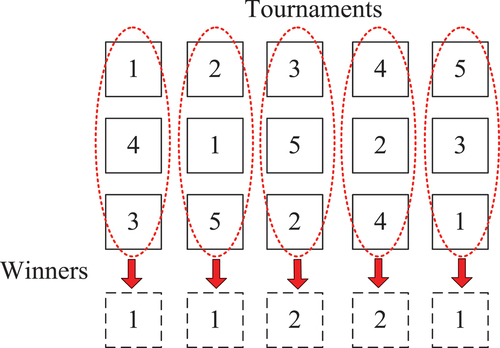
Figure 6. Crossover operator.
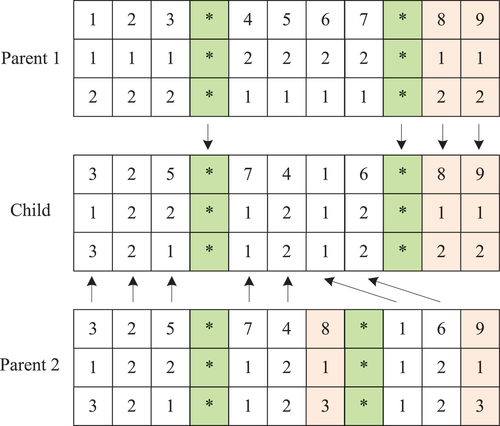
Figure 7. Hybrid mutation operator.
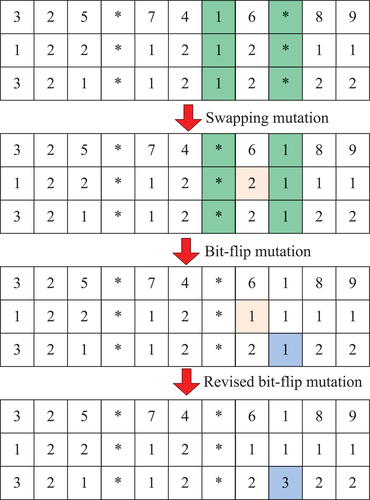
Figure 8. Pseudocode for heuristic H.
Table 2. MA parameters and their levels in the orthogonal method.
Table 3. Orthogonal array and results.
Figure 9. Main effect plot of the MA parameters.
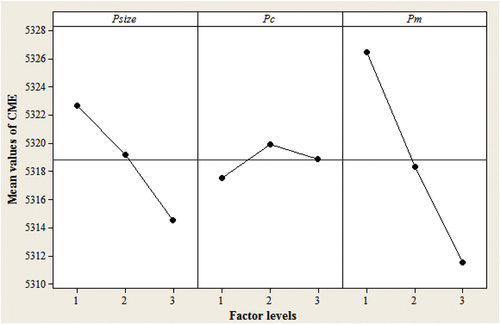
Table 4. Algorithms comparison.
Table 5. ANOVA for different problem sizes.
Table 6. Energy savings by energy-efficient scheduling with different mechanisms.
Figure 10. Pareto frontier with different weight combinations: (a) Problem = 50, (b) Problem
= 100 and (c) Problem
= 150.