
Figures & data
Table 1. DT characteristics.
Table 2. DT categories and typologies.
Figure 1. Main steps of the life cycle of pharmaceutical cannabis plants from the perspective of a producer (adapted from Chandra, Lata, and ElSohly Citation2017).
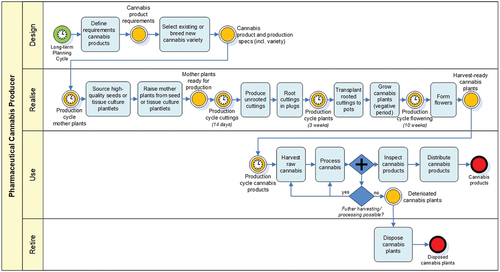
Figure 2. Anatomy of a cannabis plant.
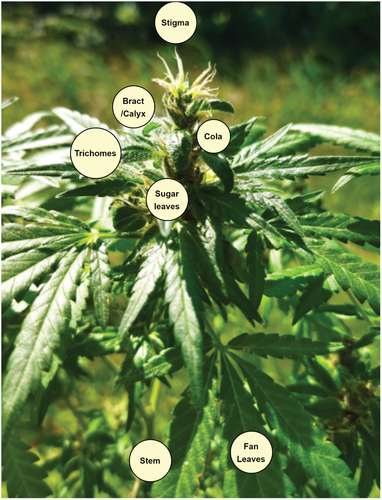
Figure 3. Adopted research methodology.
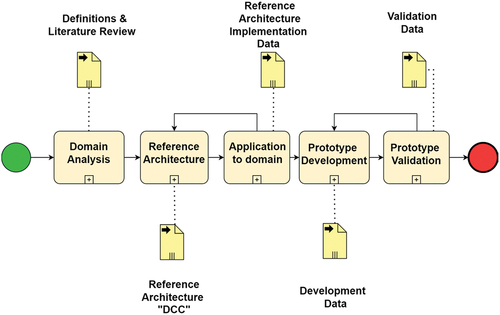
Figure 4. Guideline for the application of reference architecture.
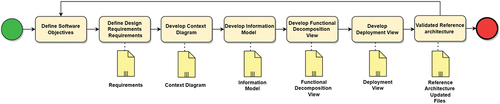
Table 3. Design requirements.
Table 4. Views point & Definition applied in the case study.
Figure 5. Context diagram.
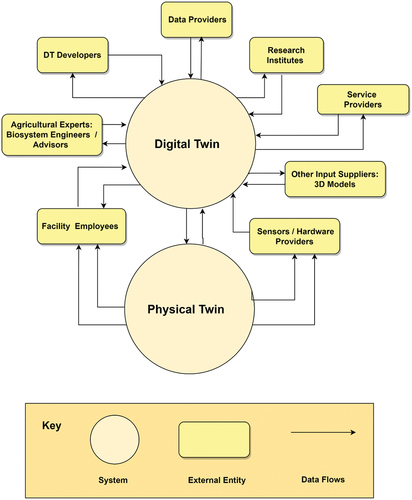
Figure 6. Information model.
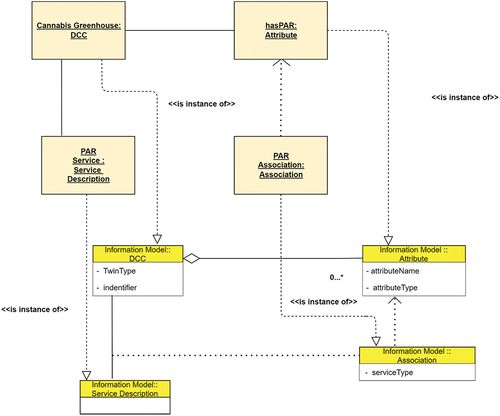
Figure 7. Functional Decomposition view.
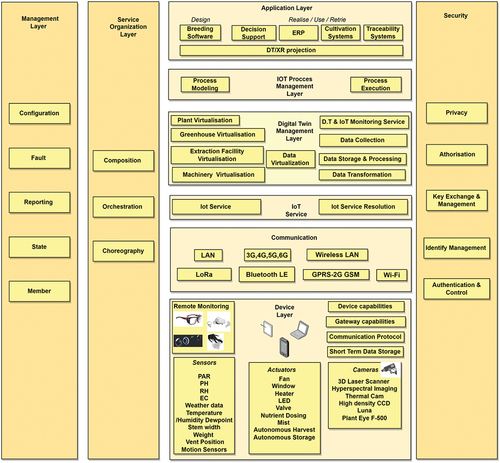
Figure 8. Deployment view.
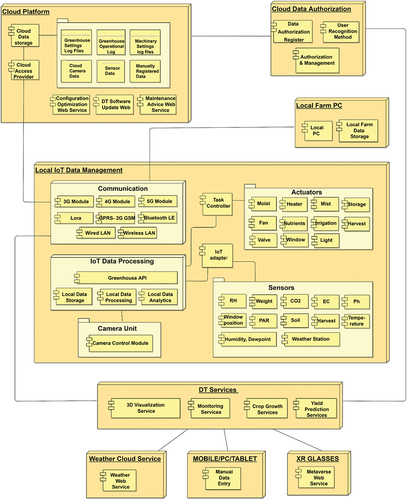
Figure 9. Functional Decomposition view of the Proof of Concept.
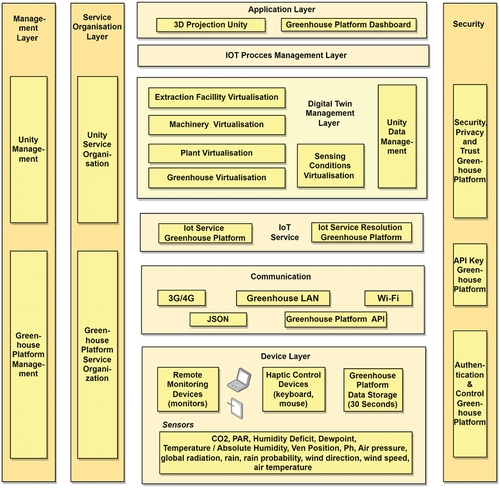
Figure 10. Internal view from bee avatar of the cannabis facility with plants in the flower formation stage.
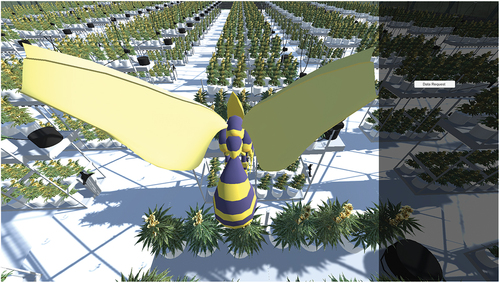
Figure 11A. Plant canopy & data visualization of connected sensors.
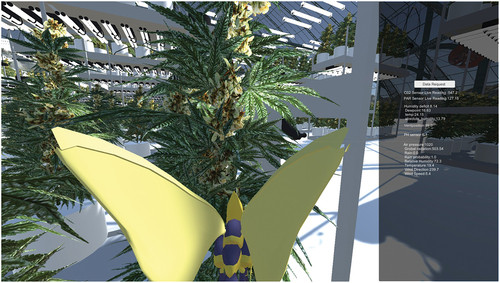
Figure 11B. 3D version of cannabis plants in flower formation.
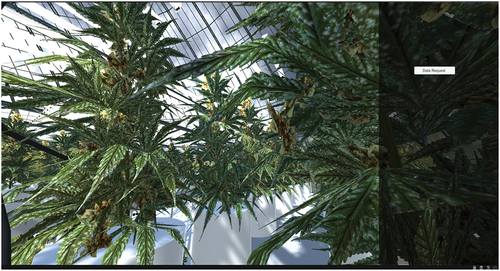
Table 5. Results of the expert validation.
Table A1. Sensor readings visualised in .
