Figures & data
Table 1. Key subject areas of the SCOPUS keyword search (N.B. one document may belong to multiple subject areas).
Figure 1. Conceptual model of the production system.
Figure 2. Schematic diagram of the thermoelectric plant.
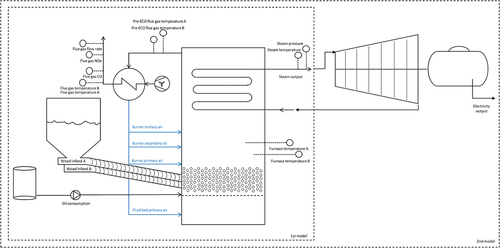
Figure 3. DEA efficiency estimation and ML training phases of the hybrid AI solution.
Figure 4. The Genetic algorithm optimisation phase of the hybrid AI solution.
Figure 5. DEA relative efficiency distributions of the two models for year 2020.
Figure 6. Correlation table of selected input, output, process control and state variables of the two models.
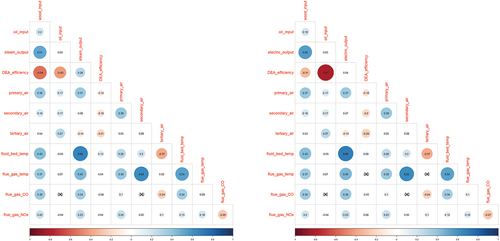
Figure 7. Relationship between process control and state variables as well as DEA efficiency achieved.
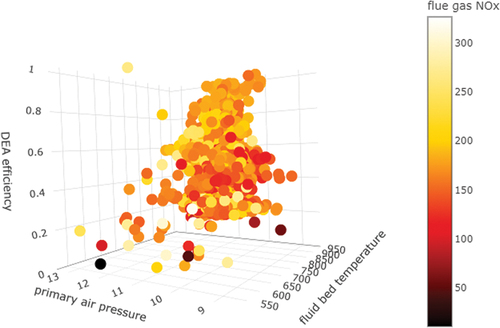
Table 2. ML model optimal parameters and performance.
Figure 8. Improvement of the fitness through generations of GA.
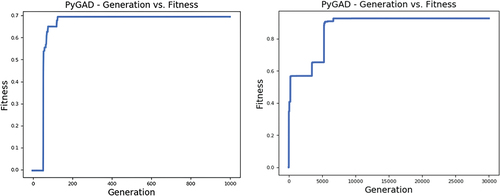
Table 3. Optimal recommendations for an output of 168 MJ/h and 48 MW/hr (model 1 and 2).
Table 4. State variable values for the optimal solution.
Table 5. Calculation time of the AI solution for models 1 and 2.
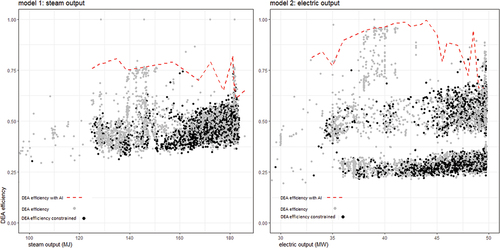
Figure 9. Efficiencies with and without the AI solution for model 1 and 2 (grey points are observations violating state variable constraints).